
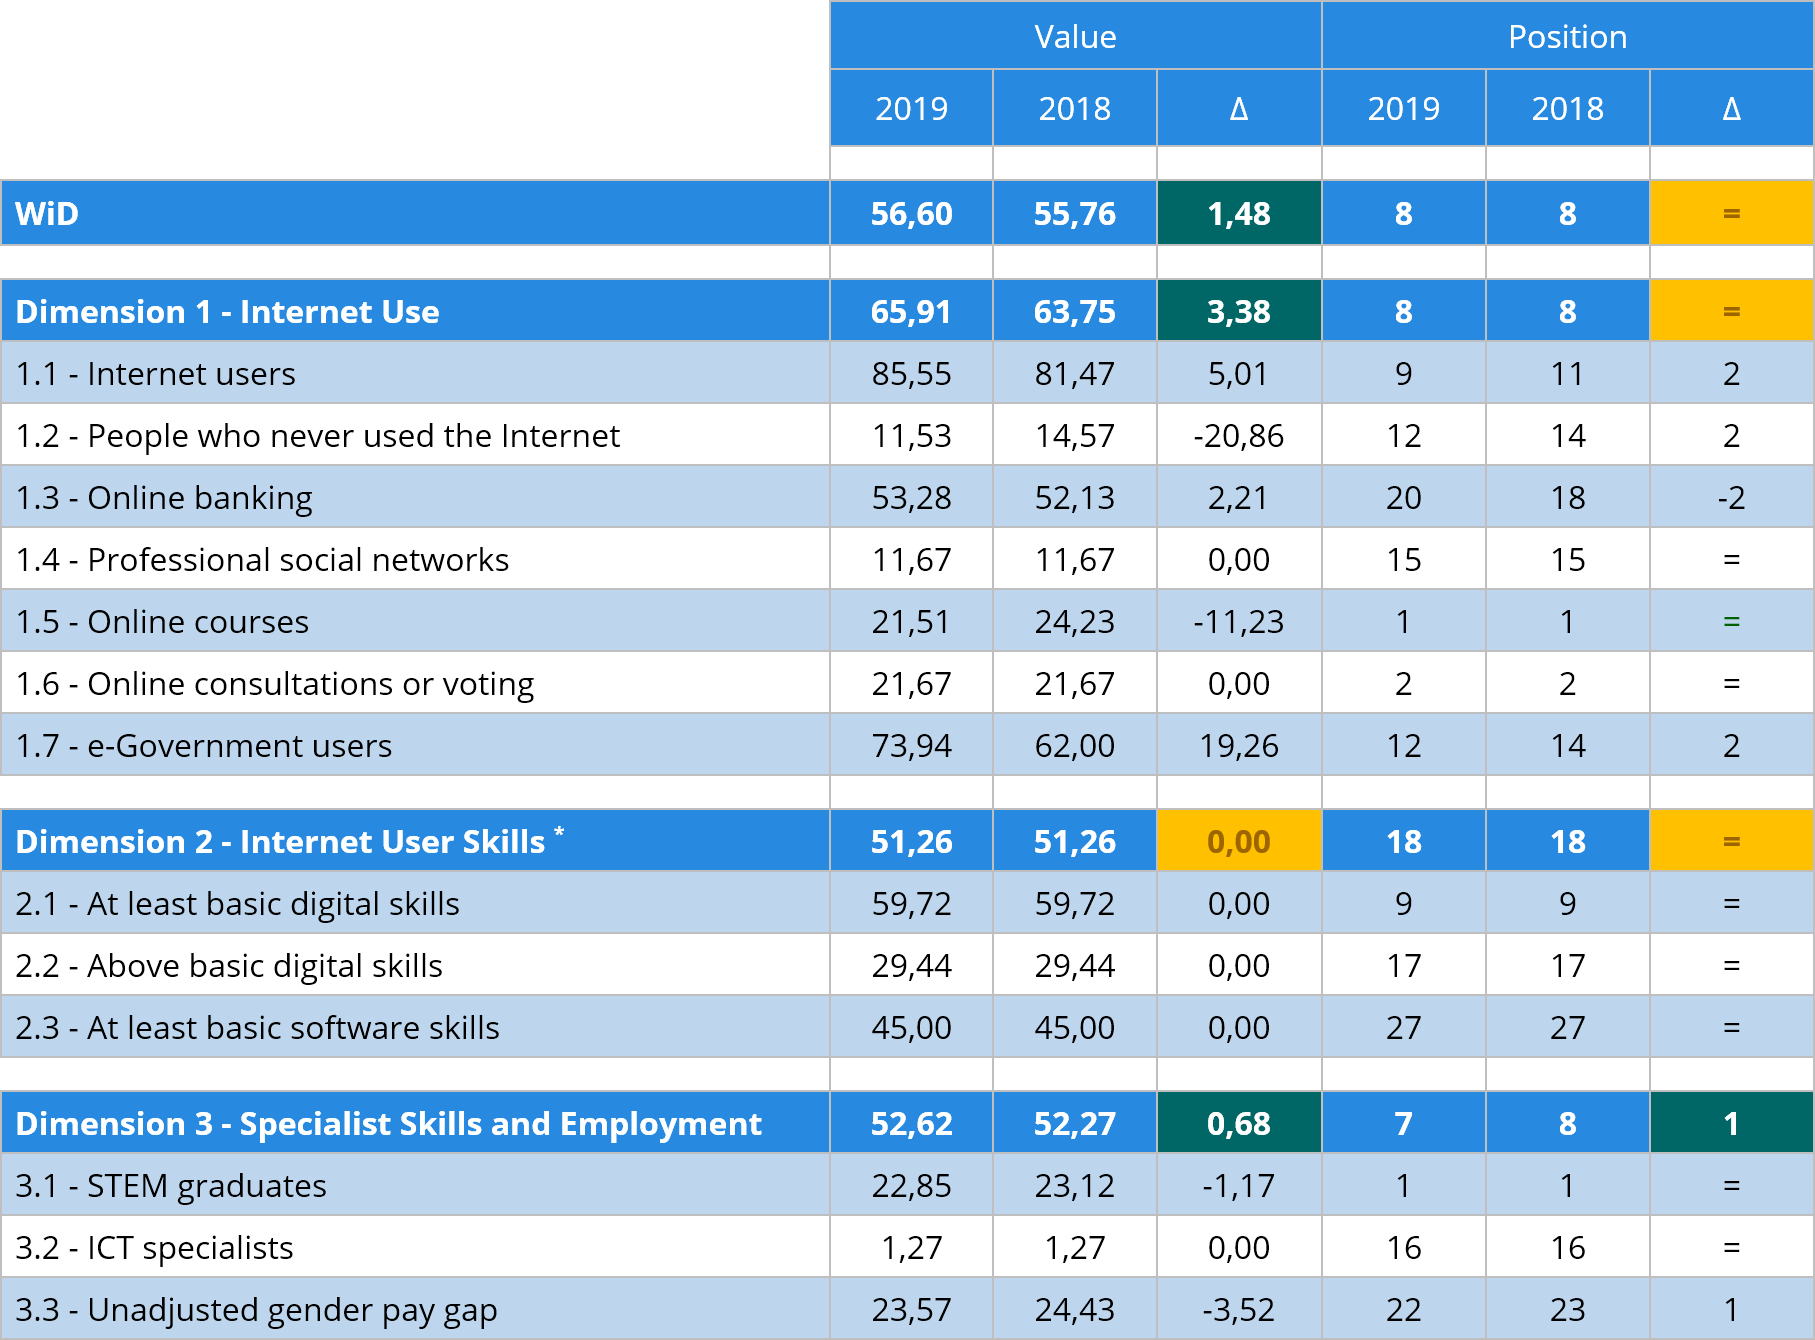
3.6. 2018-2019 WiD evolution in the Basque Country
As with the DESI, a comparative of the evolution of WiD over the last two years in terms of values and positions is made.
Note: Dimension 2 - Internet User Skills
Between 2018 and 2019 the WiD index grows from 55.76% to 56.60% but that does not allow the Basque Country to improve positions, remaining in the eighth rank. In terms of dimensions, the greatest increase occurs in the use of Internet, 3.38%. This increase is however not enough to raise the ranking beyond the previous year's position, the eighth as well. In general, the Basque Country maintains or increases positions in Internet use indicators, losing only two positions in online banking.
In the case of the third dimension, the low increase in specialist skills and employment of 0.68% does have an impact on an increase in positions from eighth to seventh. Indicators for education and labour market fall, but only those relating to
Graph 19 is presented below with the percentage evolution of each indicator in the last year.
This comparative of the WiD index indicators shows which are the ones that have grown and which have not. Due to the lack of updated data, the indicators of the Internet user's skills dimension do not evolve. The
Graph 20 below shows the evolution of the indicators at the positional level.
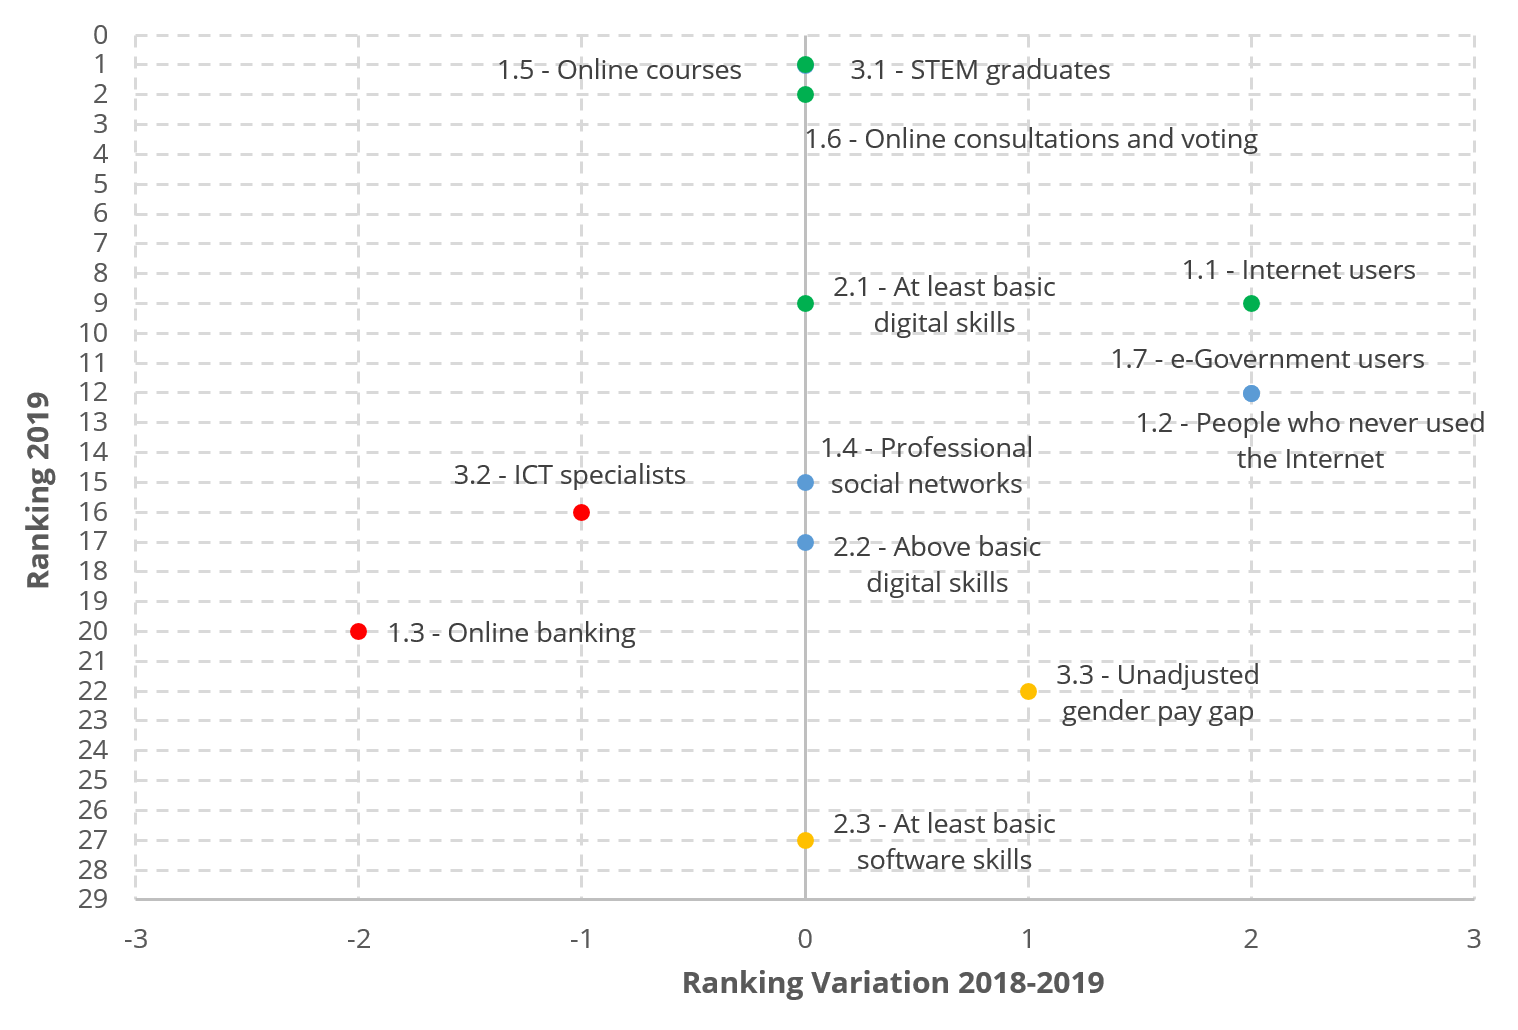
The positional analysis of indicators makes it possible to distinguish between four groups. On the one hand, there are indicators with high positions that have improved or have not varied their positions in the countries ranking (STEM graduates, at least basic digital skills, Internet and e-government users, online courses or online consultations or voting). On the other hand, the same for those indicators that have more intermediate positions (women who have never used the Internet, professional social networks and above basic digital skills). Thirdly, the same idea but for indicators with low positions (gender pay gap and at least basic software skills). Finally, there are two indicators that have lost one and two positions respectively, which are ICT specialists and the use of online banking.
Graph 21 below combines the evolution of the value and position of the indicators. The horizontal axis shows the variation of the indicators and the vertical axis shows the advance or withdrawal of positions. Dotted lines indicate the average variations of these two variables.
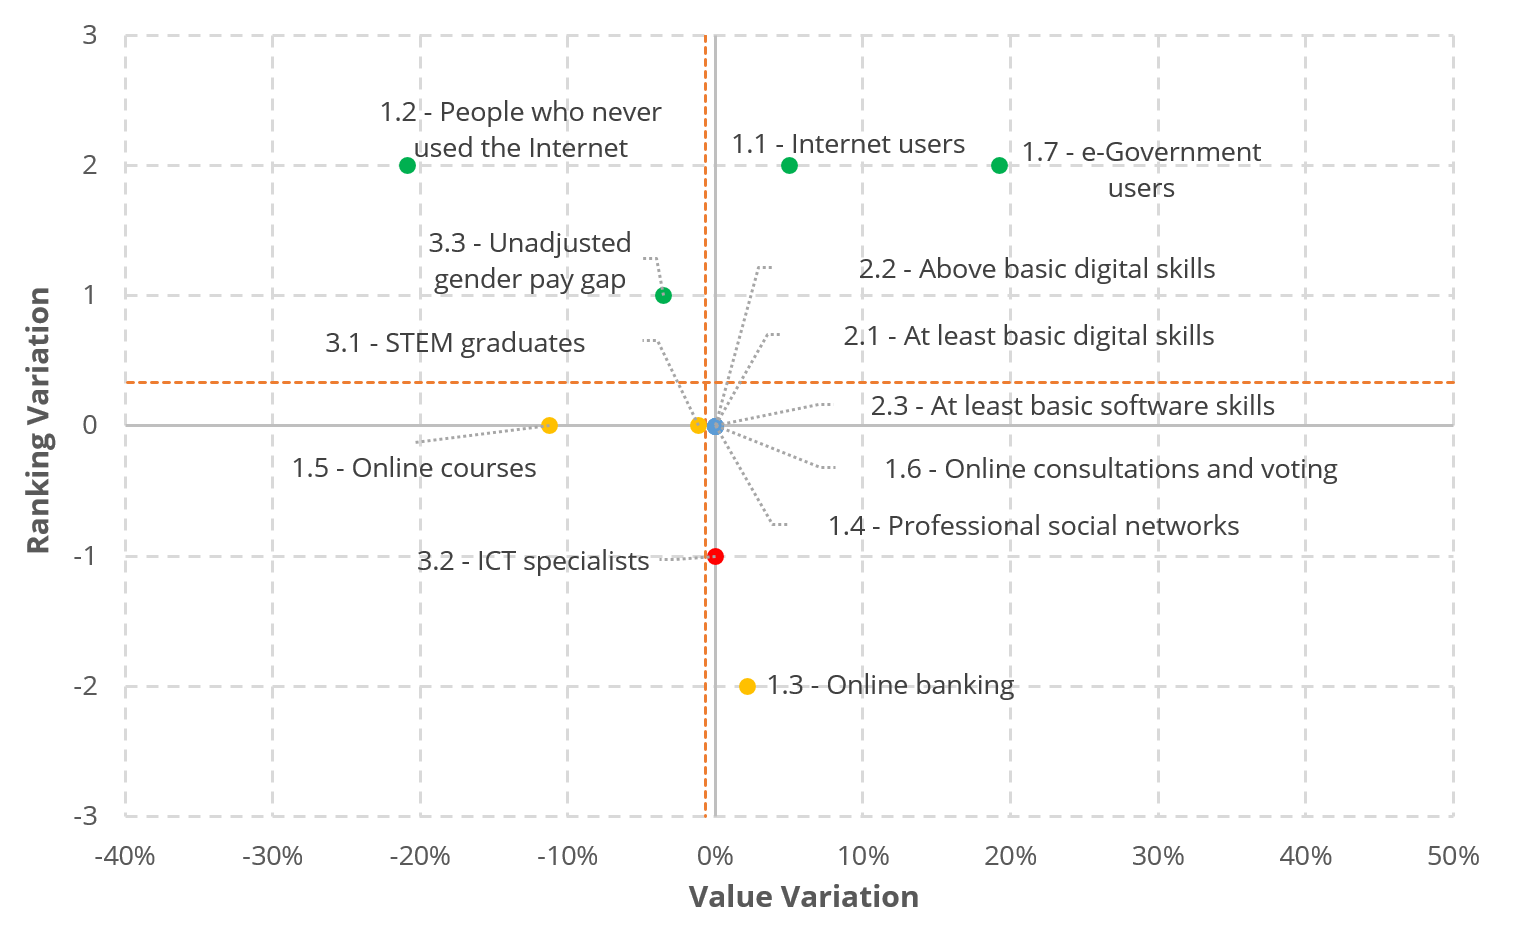
All the indicators that evolved favourably in the period show positive moves in positions (the indicators for people who have never used the Internet and the gender pay gap are decreasing but this implies that they improve), except for online banking, which has weak growth and loses two positions. Two indicators decrease but maintain positions (online courses and STEM graduates). The only indicator that loses positions, although does not decrease, is ICT specialists. Finally, there are a series of indicators for which there are no variations in their values and which do not vary their positions either.
-
For dimension 2 it is not possible to make a temporary comparative due to the lack of updated data in the year 2019.
-
“Unadjusted gender pay gap” and “People who never used the Internet” indicators are inverse, so a decrease means a positive evolution of the indicator.