
2.3.5. Digital public services
The two sub-dimensions considered in the digitalisation of public services have to do with the Administration and with health. While the services of the Administration have a weight of 80% in the dimension, those of health contribute with the remaining 20%.
Table 9 shows the values and positions for these two sub-dimensions.
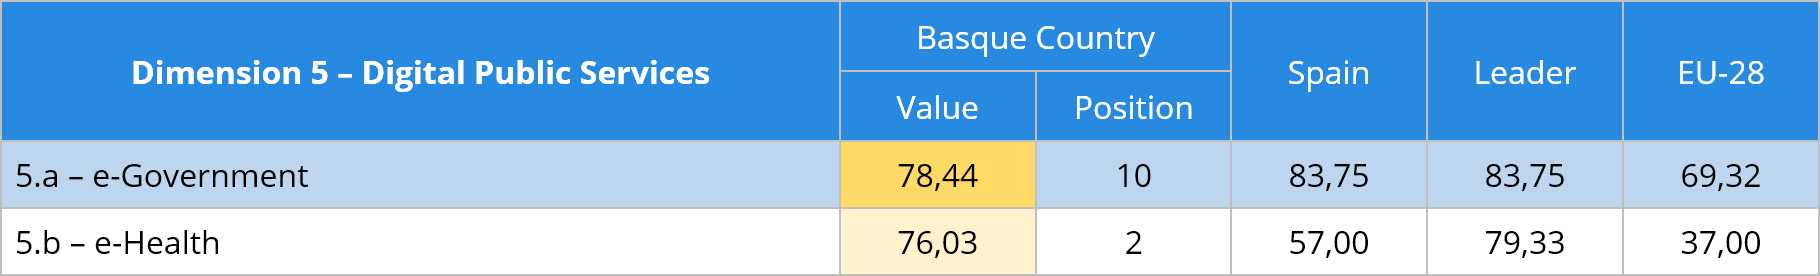
The services available electronically from the Public Administrations of the Basque Country show correct levels, almost ten points above the EU-28 average, in the tenth position, in the case of certain general services, and more than twice as many the average, in the second position, in the case of specific health services.
Table 10 below details the electronic government and health indicators.
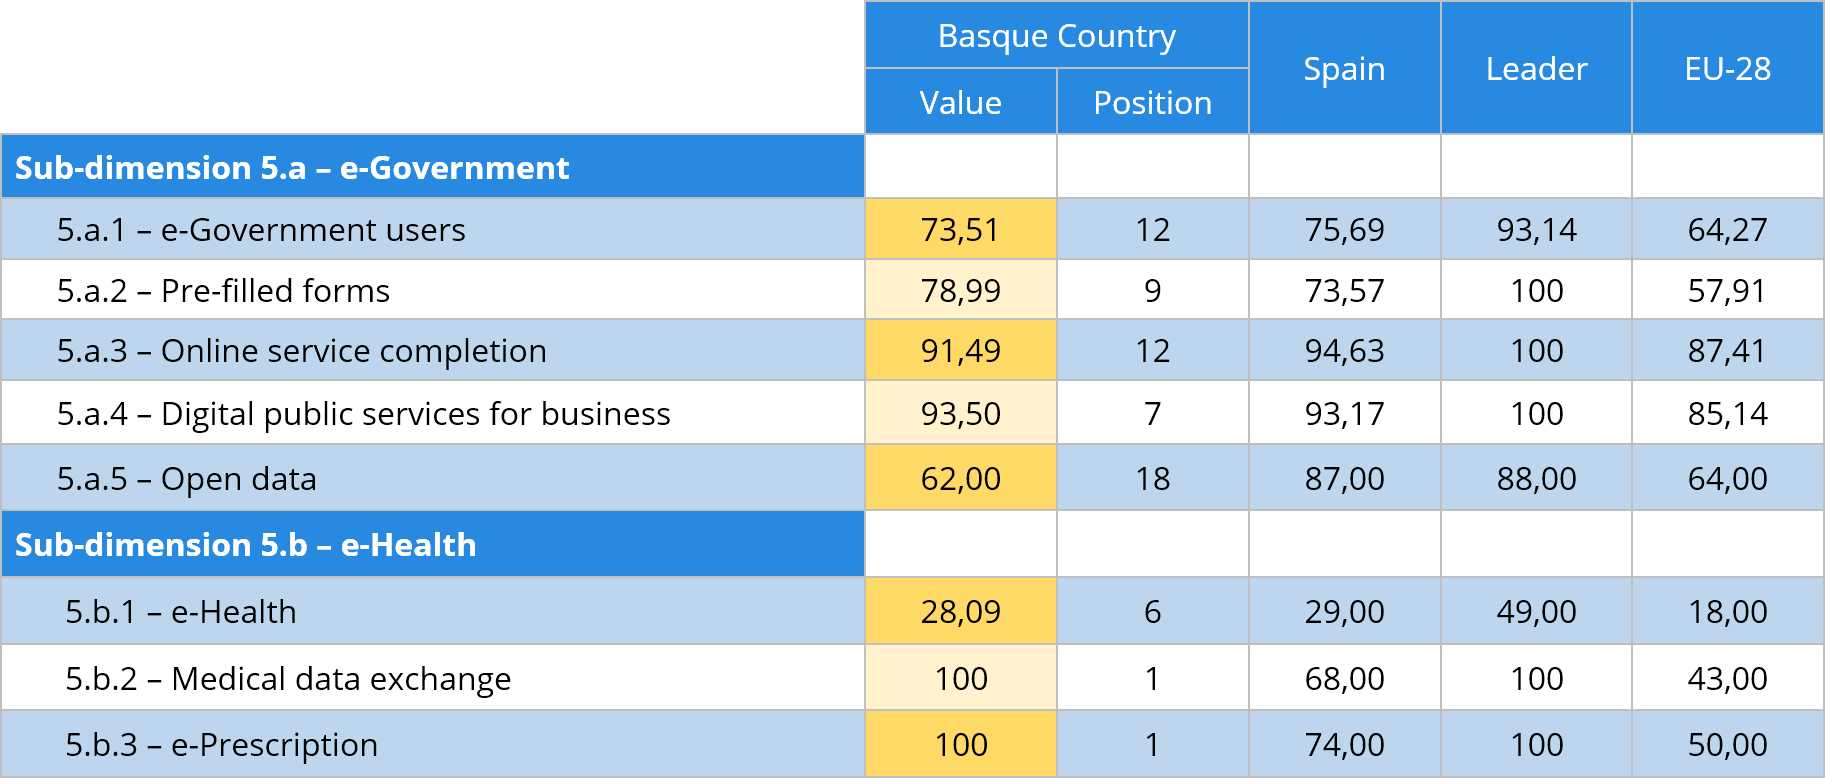
The sub-dimension related to electronic government reflects good results, even without occupying leading positions. For several indicators there are leading countries that reach 100%, and although it is not the case of the Basque Country, their results are above those of the EU-28 average. The exception is found in the open data indicator, two percentage points lower than the average.
The sub-dimension focused on health services has very remarkable values, especially in the exchange of medical data and electronic prescription, where it reaches 100% and positions itself as a leader.
-
The questionnaire used for the preparation of indicator 5.a.5 has changed compared to last year.
Indicator 5.b.1 has been estimated from data of Spain.
For more information see 5. Methodological note