
3.5. Basque Country gender digitisation comparative 2019
This section compares the WiD index indicators obtained for women with their equivalents for men in the Basque Country, in Spain and in the EU-28. The following tables group the indicators for each dimension. The differential has been calculated as a percentage of men.
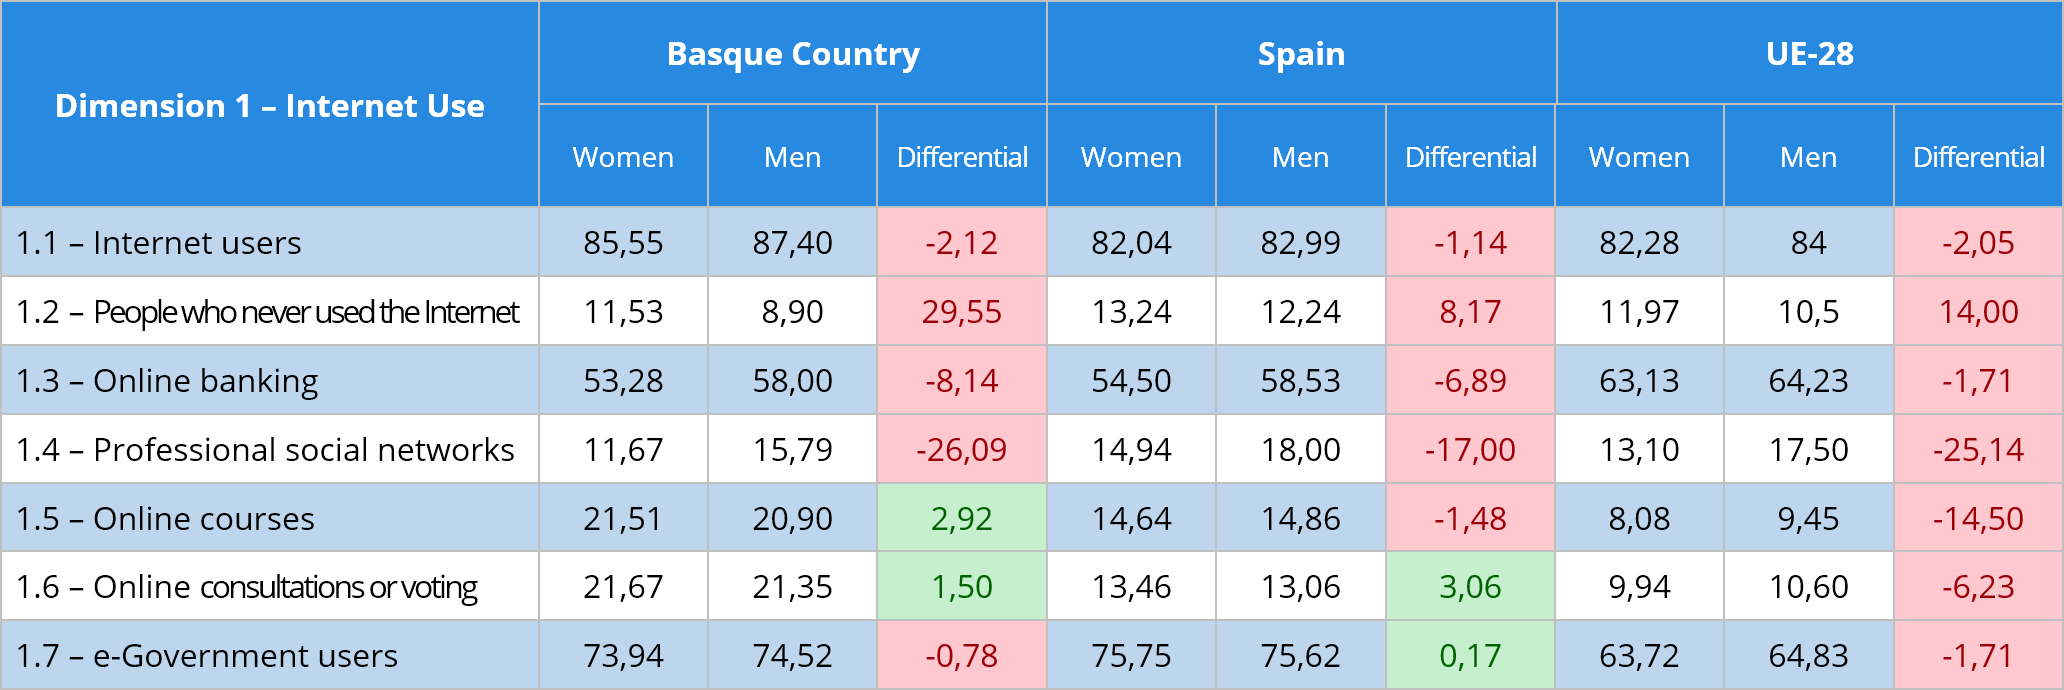
Note: 1.2 - People who never used the Internet
In the first dimension, represented in Table 15 and referring to the use of Internet services, some peculiarities of the Basque Country data are revealed when comparing them to the results of Spain and the EU-28. On the one hand, in the online courses, the positive differential presented by the Basque Country indicates that there are 2.92% more women than men who take them. This is not the case in Spain, where the differential is negative, nor in the EU-28, which has a much larger negative differential. Something similar happens with votes or consultations made over the Internet by women, where 1.5% more women than men voted or did consultations online in the Basque Country. In Spain, this proportion of women is higher than in the Basque Country, while in the EU-28 it is negative.
In the rest of the indicators, the comparative reflects similar patterns between the Basque Country and the other territories. This is the case of the indicator of people who make use of electronic government, where the gender gap that exists in the Basque Country is close to the one observed in the EU-28, although lower. However, while in both territories the differential is negative (the proportion of women is lower than that of men), in Spain it is positive.
However it is in the indicators that show a greater use of online services by men (negative differentials) that the situation of the Basque Country is more comparable to the one of Spain and the EU-28. This happens with the frequency of Internet use, people who never used the Internet (see footnote), online banking and professional social networks, with the gap between both genders being greater in the Basque Country than in the other compared territories.
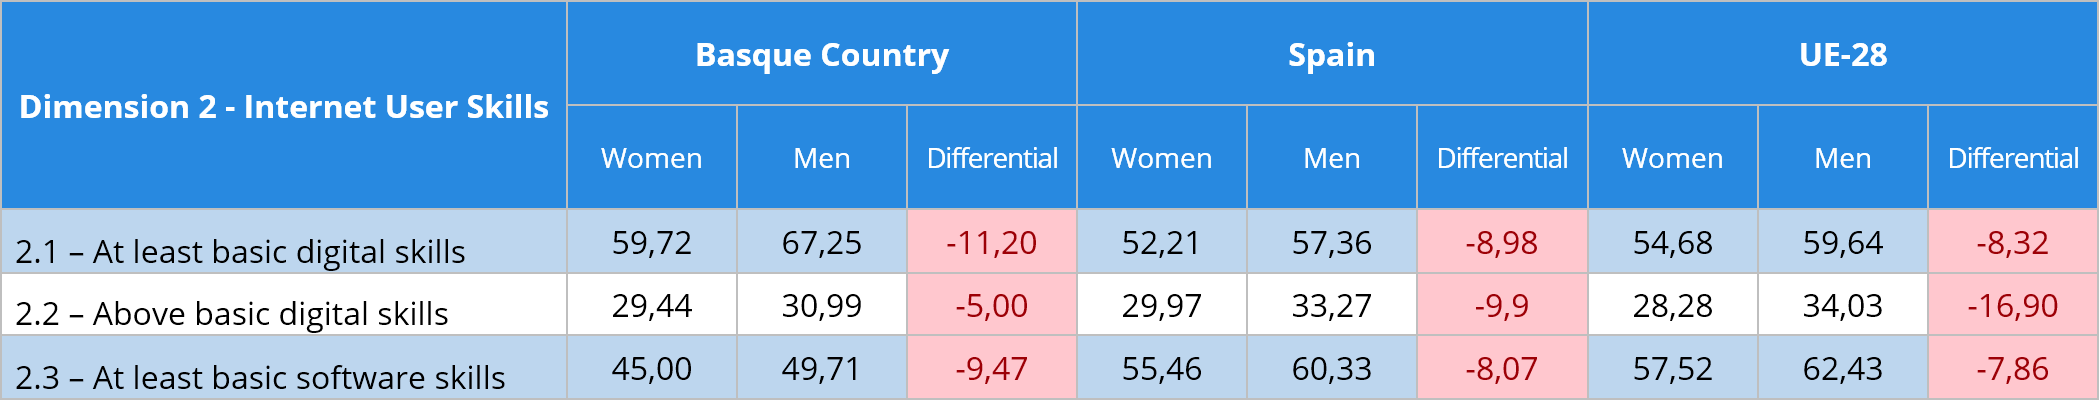
The three indicators of the second dimension, presented in Table 16, measure the digital skills required to make use of the Internet and show higher percentages among men than among women in the Basque Country, in Spain and in the EU-28 average.
The gender gap is smaller in the Basque Country compared to Spain and the EU-28 only in the indicator that takes into account higher levels of skills. In the indicator that measures the level of less developed digital skills and in the one that measures specific "software" skills, the differential is more pronounced in the Basque Country.
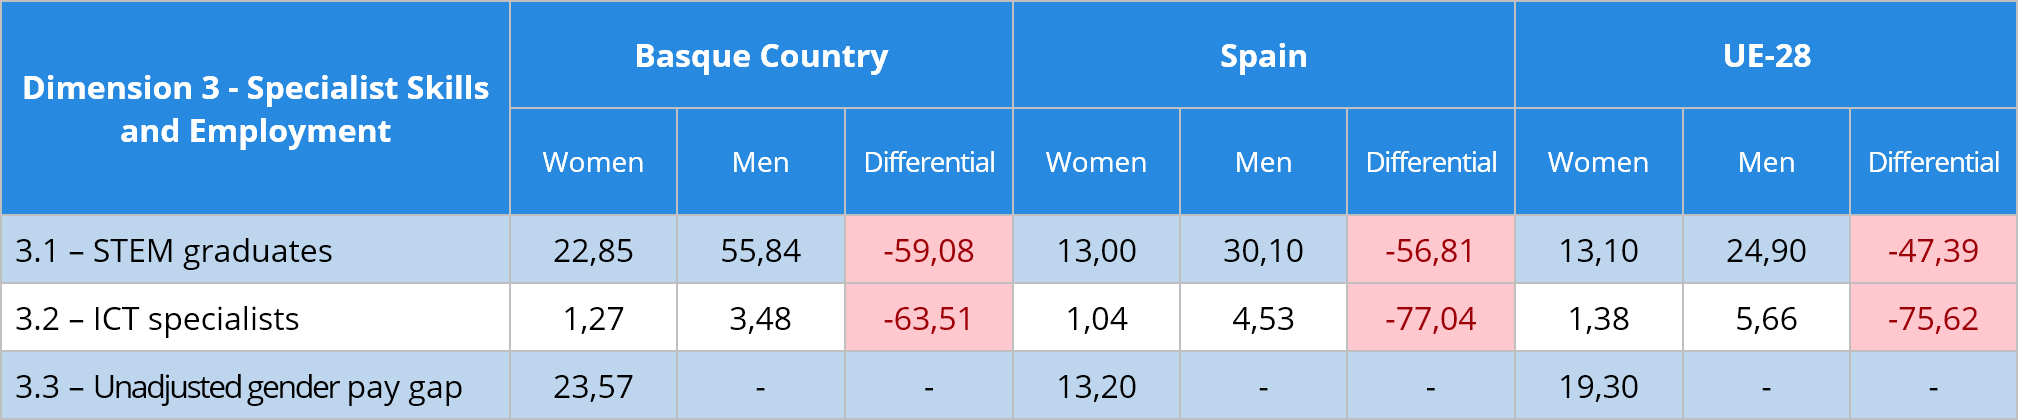
Table 17 contains the comparative of the third and last dimension and, like the previous one, it shows a fairly homogeneous situation between the three territories. Again, in all indicators the gender gap is negative, indicating that there are higher proportions of both STEM men graduates and ICT men specialists in relation to the proportions of women in these fields. The last indicator, which measures the wage gap between men and women, has no gender comparative but, as seen above, in the Basque Country it is higher than in Spain or in the EU-28
The gender difference margin is higher in the case of STEM graduates from the Basque Country than from Spain and the EU-28, while the one of ICT specialists is lower in this territory than in the rest.
-
Positive values indicate a negative differential as this indicator is inverse.