
2.5. 2017-2019 Evolution of the DESI in the Basque Country
In this section, the temporal progression of DESI and its components in the last three years is analysed in detail. In order to compare each of the indicators, a homogenization work has been carried out, both on the methodology applied and on the sources used. In this sense, as noted in the 2018 DESI report, the methodological changes incorporated each year represent a recalculation of the DESI of previous years, so the final values of the DESI 2017 and DESI 2018 presented in the following table do not coincide with those obtained last year.
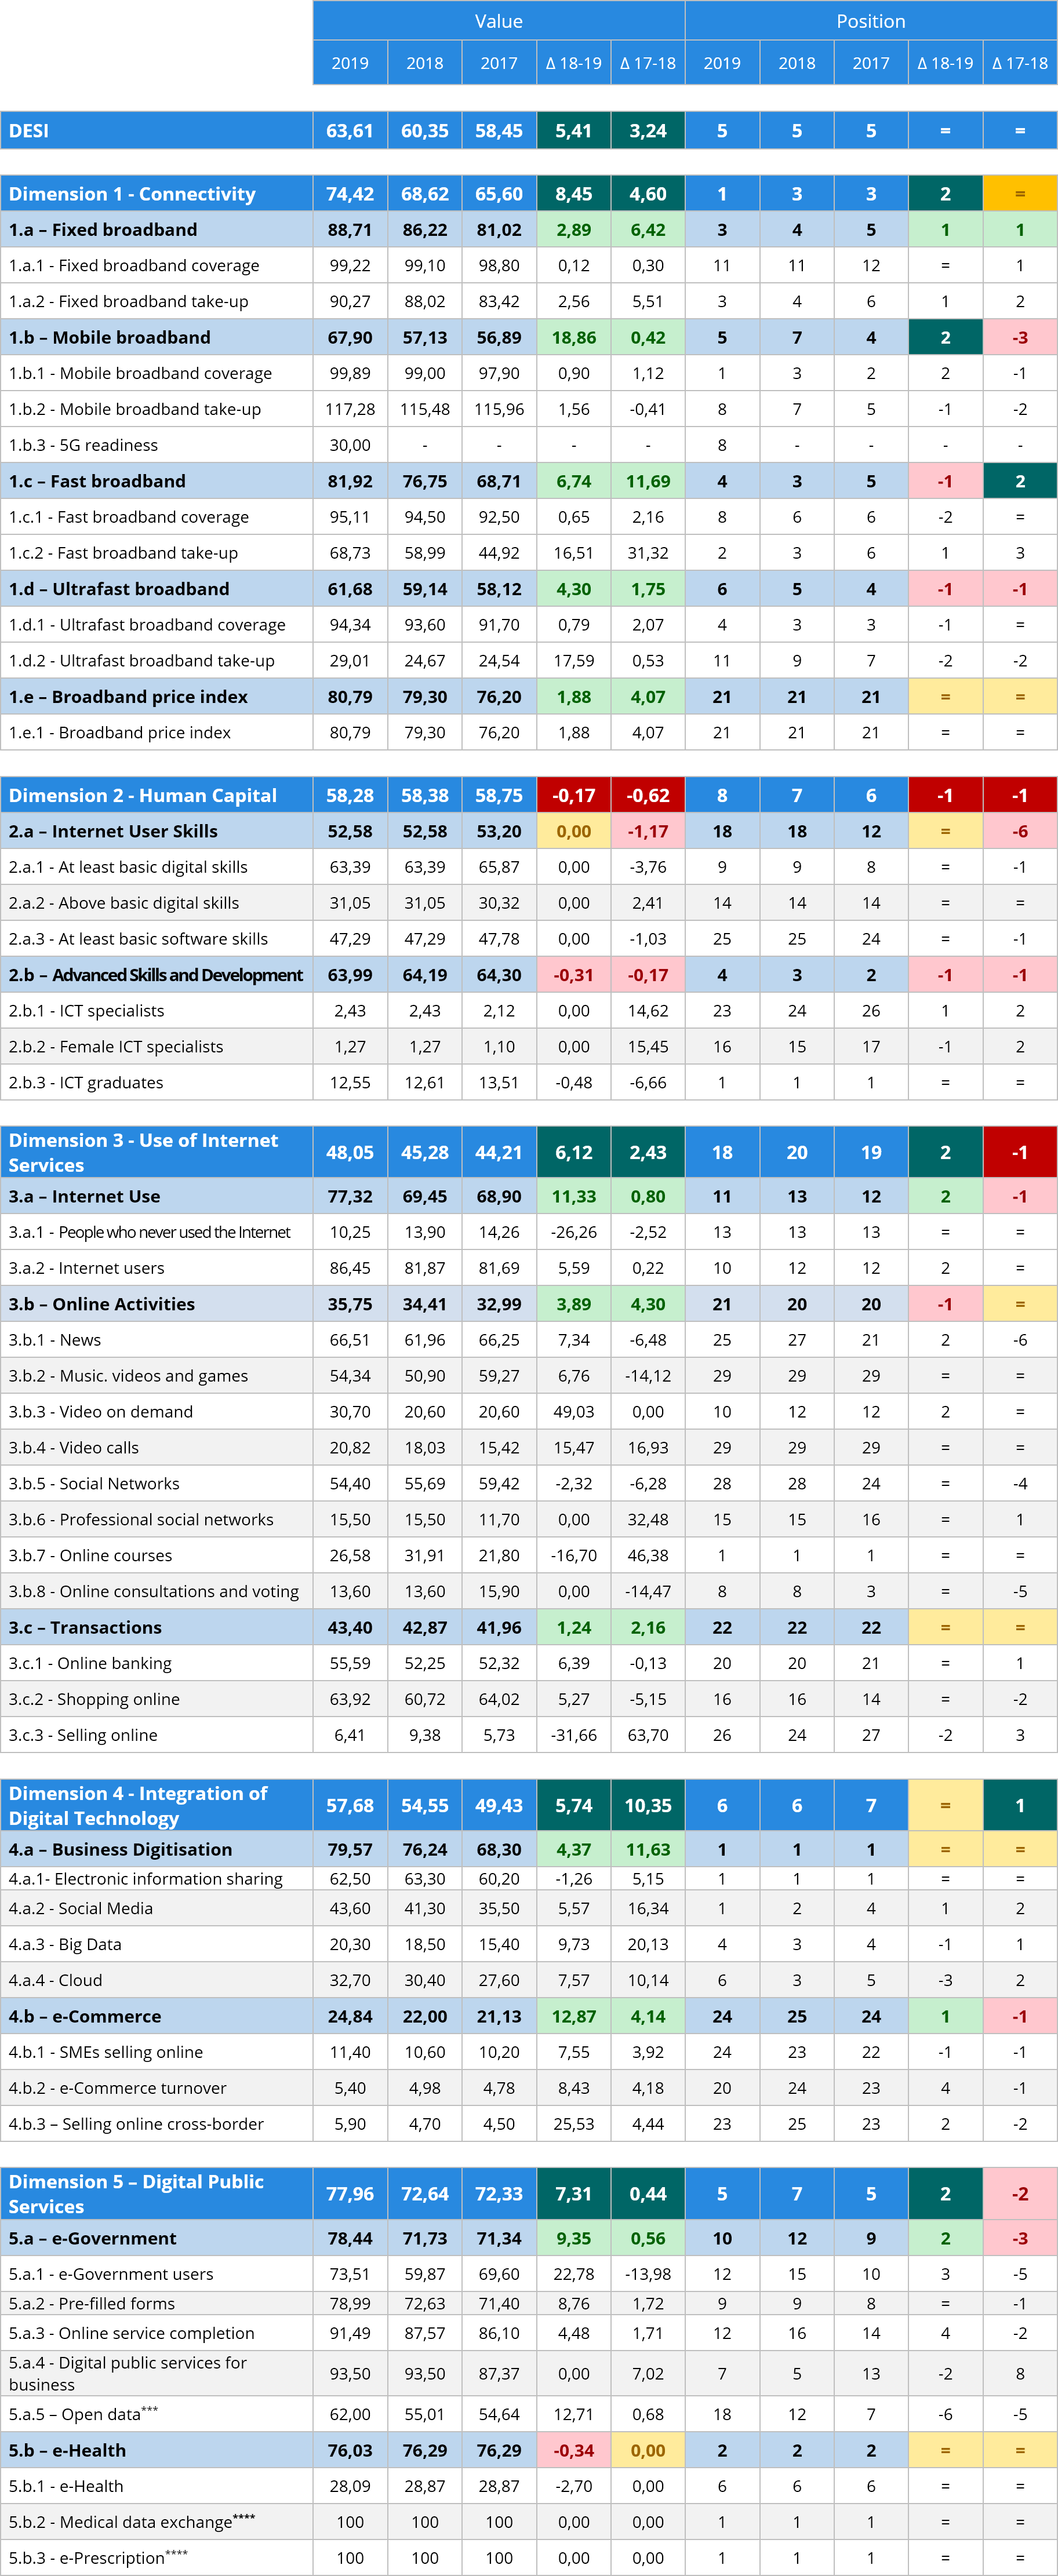
Below are the results of the DESI for years 2017, 2018 and 2019, both at the level of values and positions and at their respective variations.
Notes: * ** *** ****
The analysis of the temporal evolution of the DESI index is based on a comparative of the last three years. As indicated above, the DESI methodological changes entail an update of the index of previous years so that this temporary comparative is possible. Two periods are thus established: 2017-2018 and 2018-2019, for which the percentage of evolution of the values of indicators, sub-dimensions, dimensions and final index is calculated, as well as their position variations.
The evolution of the DESI index shows a growing sign over the three years, with a higher speed of progress in the third year compared to the previous year, from 58.45% in 2017 to 60.35% in 2018 and finally to 63.61% in 2019. However, this has not been enough to improve positions, so it maintains, continuously, the fifth place.
A comparative between dimensions shows that, out of the total of five, four of them grow. Of those four, only the digital technology integration dimension does so at a lower percentage in the last period, so it does not improve position. The remaining ones have a greater growth in 2019 than in 2018, which allows them to be two ranks ahead compared to the previous year. The exception to this trend happens in the human capital dimension, which shows decreases and loss of position in both periods, although the decline is smaller in the second one. In this regard, it is pertinent to note that there is no updated data between 2018 and 2019 for the sub-dimension of Internet user skills indicators as well as for the ICT specialists indicators of the advanced skills and development sub-dimension, so it has not been possible to analyse the real evolution of these sub-dimensions.
Of all the dimensions of the DESI of the Basque Country, connectivity is the one that grows the most in 2019 and does so in a higher percentage than in 2018 (8.45% vs. 4.60%). The rise of positions of the whole dimension until reaching the first place, two positions in advance with respect to the previous years, should be noted. The sub-dimensions also show growth, although not in all cases these are higher in 2019 than in the previous year. The positions, on the other hand, offer more disparate results: while in fixed and mobile broadband one and two positions are improved respectively, in fast and ultra-fast broadband one position in each is lost. In the case of the price index there are no changes. As for the indicators, of the ten that exist in connectivity, all with positive growth, only the fixed and fast broadband take-up and mobile broadband coverage have improved positions. On the other hand, there are two indicators with a successive loss of positions: mobile and ultra-fast broadband take-up.
The human capital dimension is the only one that shows decreases in the two periods, although the decrease is smaller between 2018 and 2019 (-0.17% and -0.62%). In each period the Basque Country has retreated one position. As mentioned above, it should be taken into account that for most indicators of this dimension there is no updated data for 2019, which limits the analysis of its evolution. On the other hand, the sub-dimension related to ICT skills decreases during the two periods and, in this case, more in the second one. This decrease is due to the lower number of graduates in ICT although the wide margin allows retaining the first rank. As for the ICT specialists, no updated data are available in 2019, but between 2018 and 2018 they grow, improving one position in the case of the specialists in general and losing another in regards to women specialists.
The use of Internet services evolves positively throughout the period. The overall dimension increases more in 2019 than in 2018 (6.12% and 2.43%) and rises two positions. At the level of sub-dimensions, although they all grow, only in the general use of Internet it improves two positions. In online activities and transactions, the position is lowered or remains the same. In the previous period, on the contrary, no position is improved within the sub-dimensions. At the indicators level, of the total of thirteen, eight increase, but only Internet users (which does not vary the previous year), news (which last year recedes six positions) and video on demand indicators (for this Indicator there is no updated data for 2018) improve their positions.
In the field of companies, growth results are again obtained for the period although, unlike the other dimensions, the increase is lower in 2019 (5.74% vs. 10.35%) and there is no change in rank. The same happens with the sub-dimension of business digitalisation, where the Basque Country maintains the first position. Only negative growth occurs in the electronic information exchange indicator, although, as for the sub-dimension, the Basque Country remains in first rank. The new first position in social networks, despite a lower growth than the previous period, is also to be highlighted. In the case of electronic commerce, the higher growth is reflected in the improvement of one position, despite the fact that one indicator (SMEs that conduct electronic commerce) loses another one and does so for the second consecutive year. Those referring to turnover and cross-border sales grow with upgraded positions.
The dimension of digital public services is the second in terms of growth (7.31% and 0.44%), after connectivity. It is a much higher growth than the previous period, which allows it to recover the two positions lost then. In the sub-dimensions the behaviour is uneven amongst them: in the case of electronic government there is considerable growth and it rises two positions, however the electronic health decreases in the second period although it retains the second position. Four out of the eight indicators grow but it is convenient to specify that, for the new indicators (exchange of medical data and electronic prescription) it is not possible to obtain data from past years, so the latest data obtained is taken. Electronic health services decrease but the sixth position is maintained. Positions in digital public services for companies and open data are receded, in the latter case it is the second consecutive decline in positions despite the continued growth of the indicator.
Graph 8 shows the sub-dimensions with their respective growths or decreases in the period between 2017 and 2019.
From the whole period perspective, the sub-dimensions with higher growing results belong to connectivity (mobile (19.36%) and fast (19.23%) broadband) and integration of digital technology in companies dimensions (e-Commerce (17.53%) and business digitisation (16.50%)). On the other hand, of the total fourteen sub-dimensions, three decrease (e-Health (-0.34%), advanced skills and development (-0.48%) and Internet user skills (-1.17%)).
In Graph 9 shown below1, in the case of the indicators, during the period between 2017 and 2019, from the forty-three indicators, eight decrease. The ones with higher reductions are online consultations or voting (-14.47%), social networks (-8.45%) and music, videos and games (-8.32%), all of them belonging to the dimension related to the use of the Internet in households. At the other extreme, there are also indicators from this dimension such as video on demand (49.03%), video calls (35.02%) or professional social networks (32.48%). The fastest growing indicator in the period is fast broadband take-up (53.01%). There is no indicator from the connectivity dimension or the one related to the integration of technology that decreases.
The following chart compares the sub-dimensions through their position in the year 2019 and their value evolution during the period 2017-2019. The horizontal axis represents the rise, fall or maintenance of positions and the vertical one, the current position.
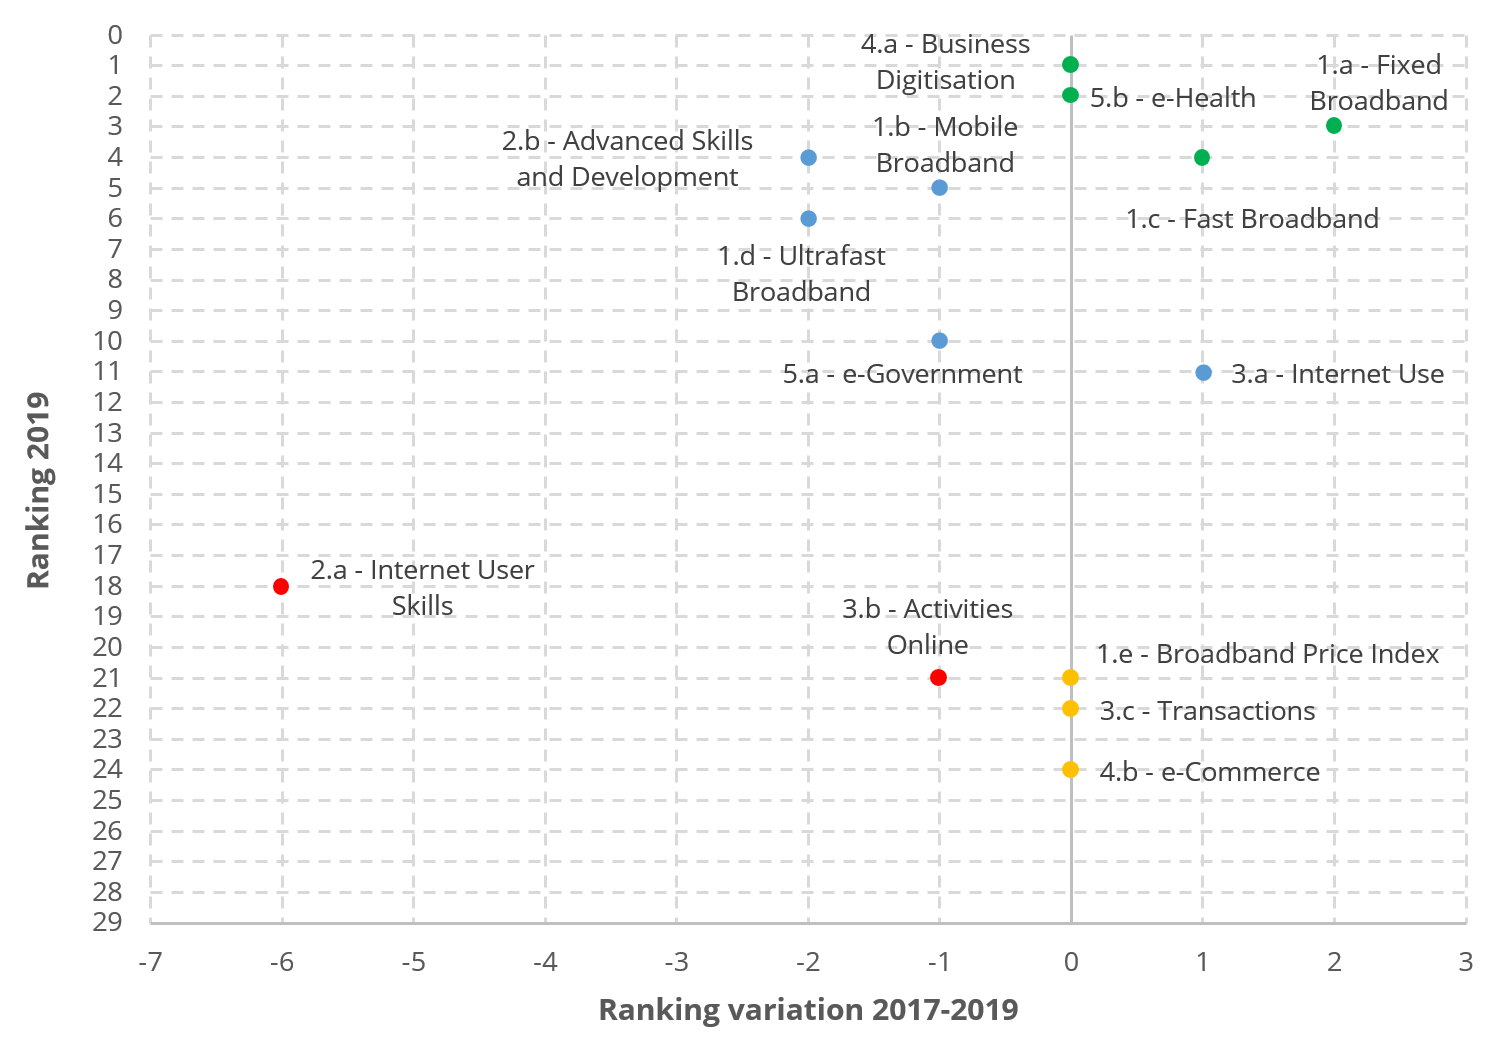
It is possible to establish four different groups; first, there are some sub-dimensions in the upper right quadrant. These sub-dimensions have high or relatively high positions and also improve their positions, as it is the case for fixed and fast broadband. In other cases, they maintain those leading positions, such as business digitisation or e-Health. Secondly, also at the top, but to the left of the graph, there are sub-dimensions that recede in the period although they retain correct positions (advanced skills and development, mobile and ultra-fast broadband and e-Government). In this left part of the graph, but below, there are two sub-dimensions with lagging positions which, in addition, fall into the ranking (Internet user skills, which loses six positions, and online activities, which loses one). Finally, below and in the centre are three sub-dimensions with the most backward positions, all of them are constant throughout the period (broadband price index, transactions and e-Commerce). No sub-dimensions with lagging positions that improve are observed.
Below is Graph 11, equivalent for the indicators.

The division in terms of groups would be analogous to that for the sub-dimensions; on the one hand, those indicators with outstanding positions that, in addition, enhance positions (social media or fast broadband take-up, among others) and on the other, those that, while maintaining correct positions, deteriorate (ultra-fast broadband coverage, cloud technologies ...). Among the indicators with less favourable positions, there are again those that improve them (online banking and sales, e-commerce turnover ...) as well as those that lose positions (news, social networks ...). The indicator that improves the higher number of positions in the period is digital public services for companies (five) and the one that loses the most, open data (eleven).
The following Graph 12 combines the evolution of the value and position of the sub-dimensions. On the horizontal axis the variation of the sub-dimensions is represented and on the vertical axis, the improvement or worsening of positions. The horizontal dotted line indicates the average variation of the value of the sub-dimensions (9.02%) and the vertical one, the average variation of its position (-0.6).
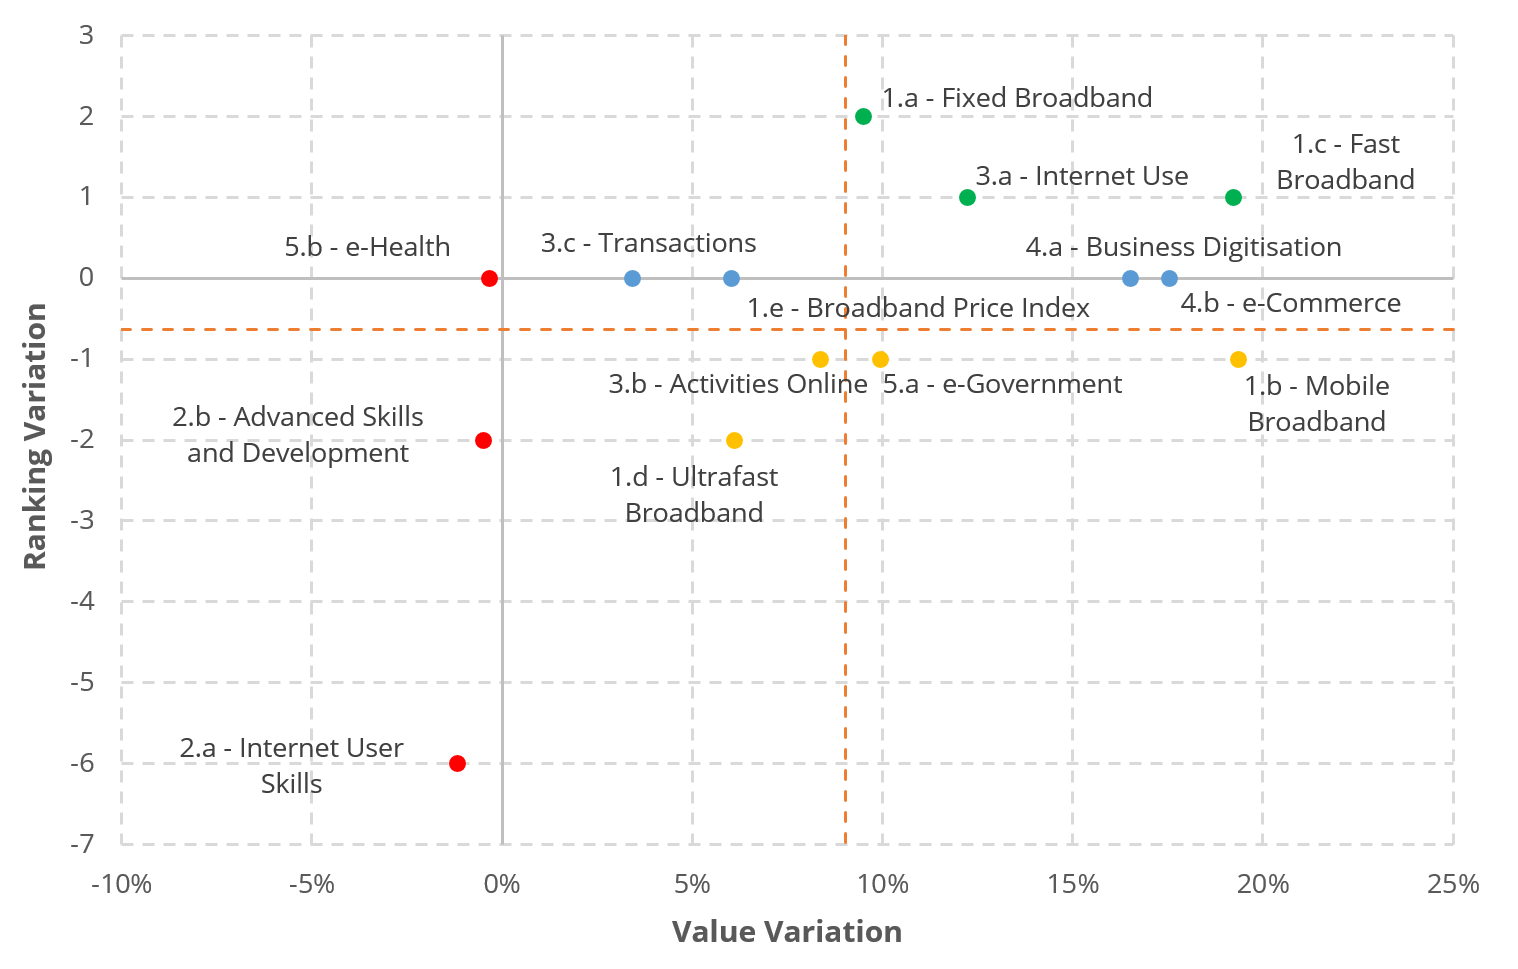
When comparing the evolution of sub-dimensions in terms of value and position, the fact that there is no relationship between growth and improvement of positions stands out. Thereby, there is the case of sub-dimensions that grow between 2017 and 2019 and yet stagnate in their positions (e-commerce, business digitisation, broadband price index or transactions). It even happens that growth is accompanied by a loss of positions (mobile or ultra-fast broadband, e-government or online activities). As for the decreases, although in no case they imply an upturn in positions, they do not necessarily cause a worsening of positions; it does happen in Internet user skills, which recedes six positions with a decrease of just over 1%, and in advanced and development skills, which loses two positions, but in e-health there are no positional setbacks despite the digression. All sub-dimensions that gain positions as they grow, they do so above the average growth of the whole set of sub-dimensions.
The same comparative at the level of indicators is shown below in Graph 13.
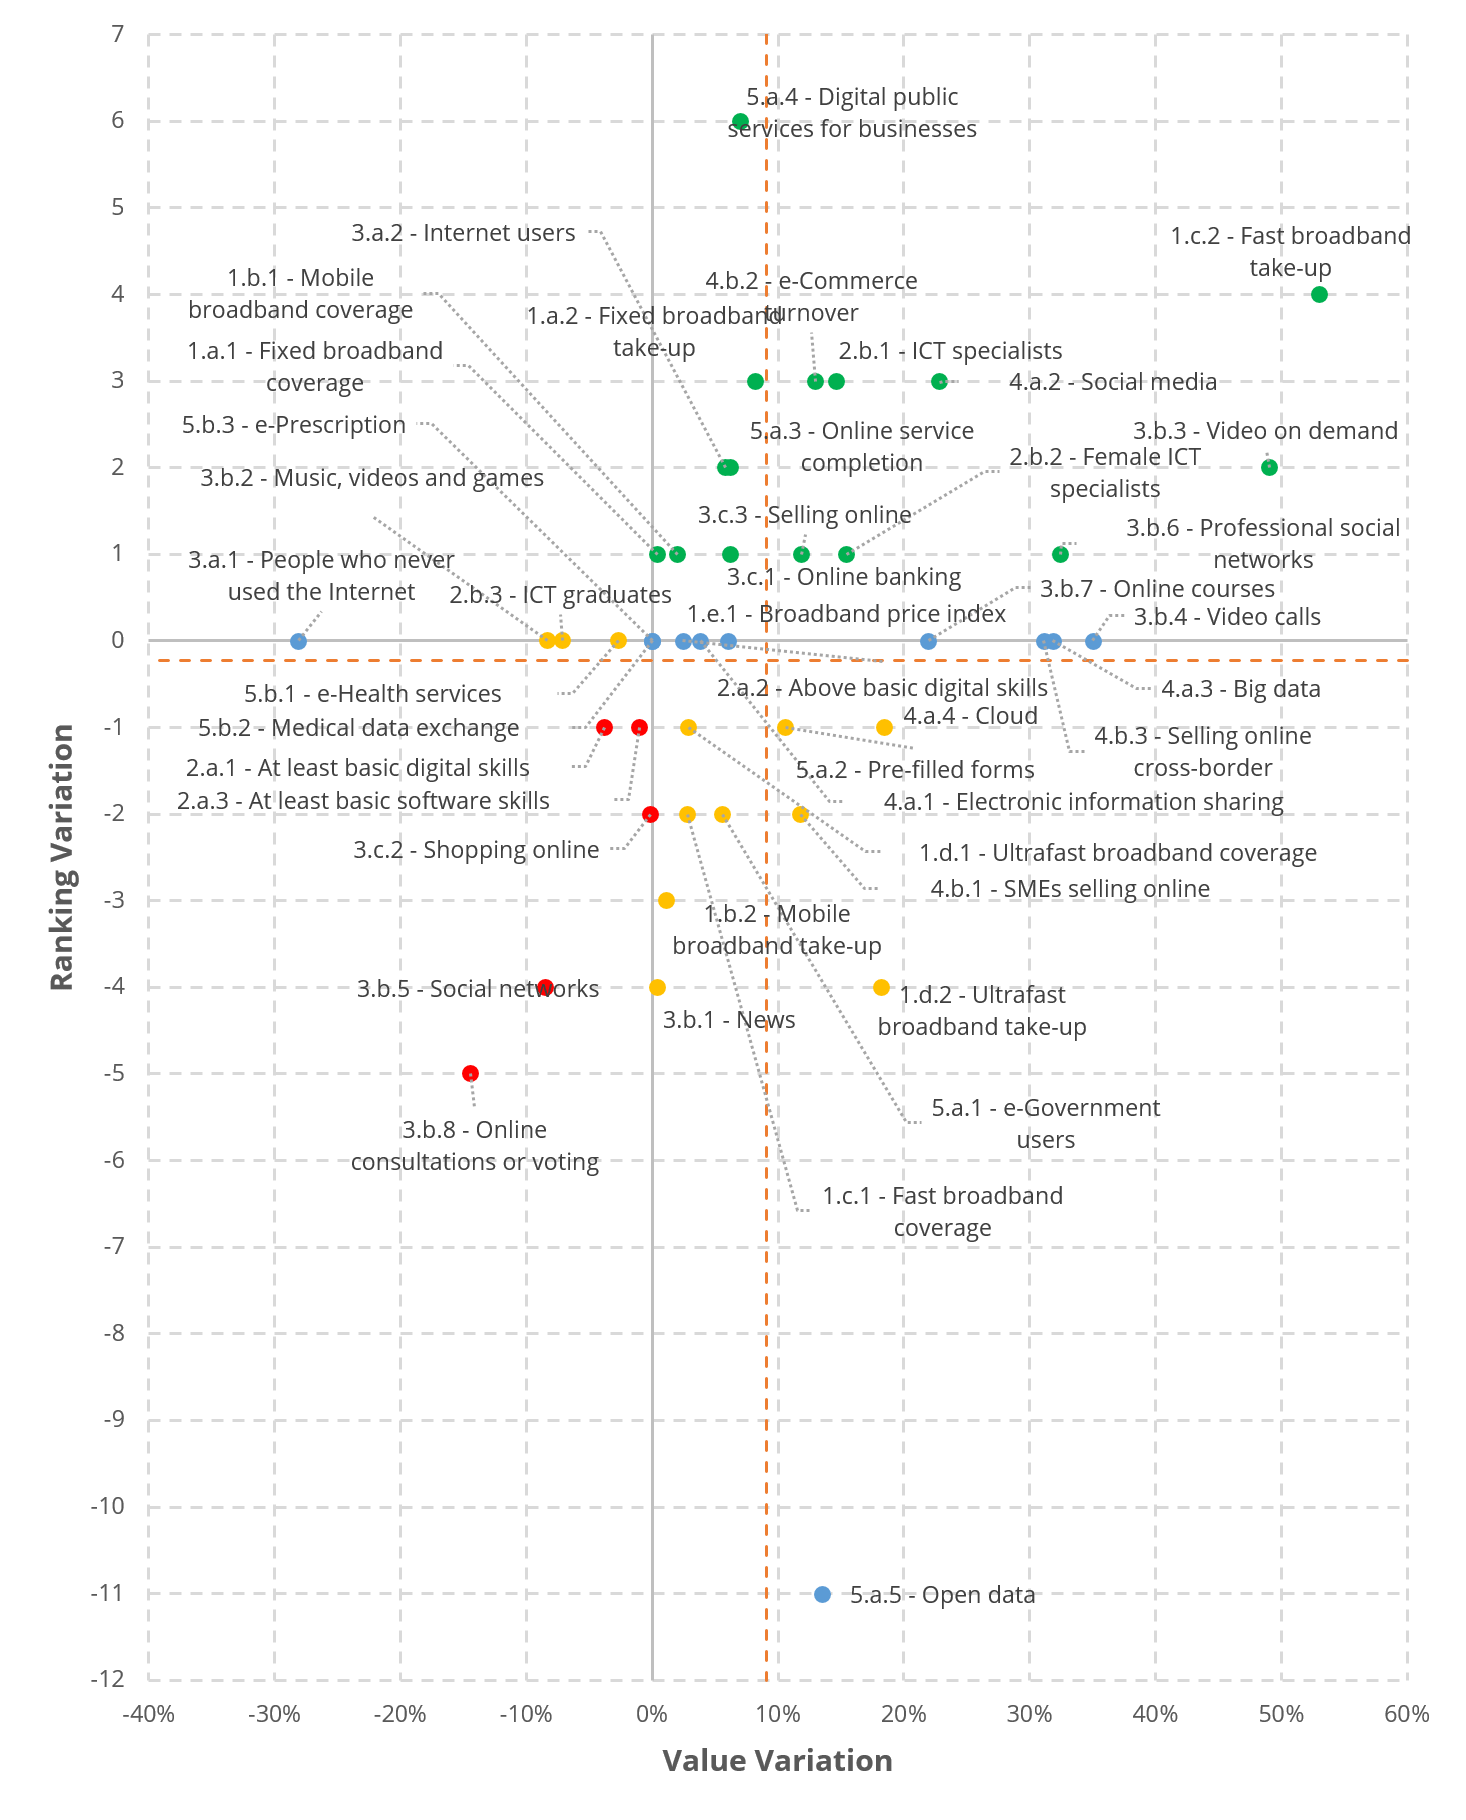
The analysis for the indicators is equivalent. Among those that do not vary in position (30%, located on the horizontal axis), there are increasing but also decreasing ones. On the other hand, 74% of the indicators have a positive growth, and from them 47% manage to raise positions (upper right quadrant) while 31% falls positions (lower right quadrant). Lastly, 12% of the indicators decrease while losing positions (lower left quadrant).
Some examples of these behaviours; the greatest growth is for the broadband take-up indicator (53.01%), that earns four positions, while the most important improvement of positions is for digital public services for companies (five positions), with a growth of 7,02%. On the other hand, the indicator that decreases the most is online consultations or voting (-14.47%) but goes back five positions, while the one with the highest number of positions reduction is the open data indicator (eleven), despite of a growth of 13.47%.
In relation to the average variations, 23% of the indicators grow above the average value (9.11%). The average variation in terms of positions is -0.2, so all indicators that lose positions are below it.
-
Sub-dimension 2.a indicators do not vary between 2018 and 2019 due to the lack of updated published data.
-
Information and Communication Technologies
-
No updated data are available for 2019.
-
No updated data are available for 2018.
-
Data for 2017 and 2018 estimated based on the data update from other countries.
-
As these are new indicators, it has not been possible to obtain data for 2017 and 2018, so 2019 data is taken.
-
-
The new indicator “5G readiness” (1.b.3) is not taken into account in the evolution of indicators.
-
“People who never used the Internet” indicator goes in the opposite direction, so a decrease implies an evolution of the indicator in a positive sense.