
2.3.3. Use of Internet services
The measurement of Internet use by households is based on generic indicators and a selection of available online services that fall into three sub-dimensions: Internet use, online activities and transactions. The one that contributes with greater weight in the dimension is the activities one (50%) while the other two share 25% each.
Table 5 presents the values and ranks of the three sub-dimensions included in the dimension of use of Internet services in households.
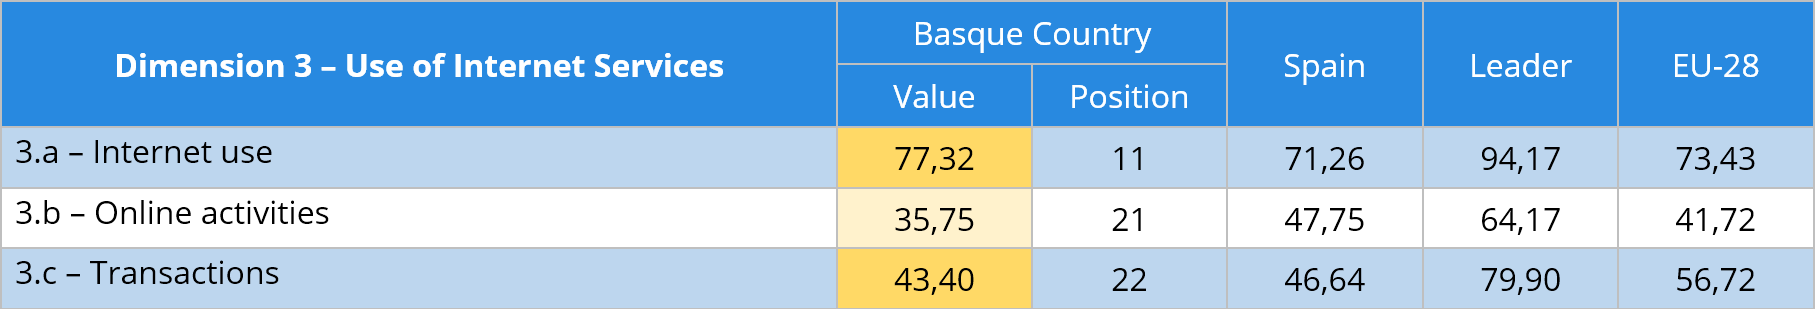
The Internet usage sub-dimension consists of two indicators that measure both the proportion of regular users and non-Internet users. The second sub-dimension refers to online activities and is the largest in terms of number of indicators, adding up eight. This sub-dimension includes activities of various types, from leisure, communication, social interaction, etc.
Finally, a last sub-dimension measures some of the transactions that can be carried out on the Internet such as the purchase and sale of goods and services or electronic banking.
The Basque Country is above the EU-28 average only in the first sub-dimension. Both in the use of the Internet for online activities and for transactions, it occupies relegated positions.
The indicators that measure the use of the Internet are detailed below.
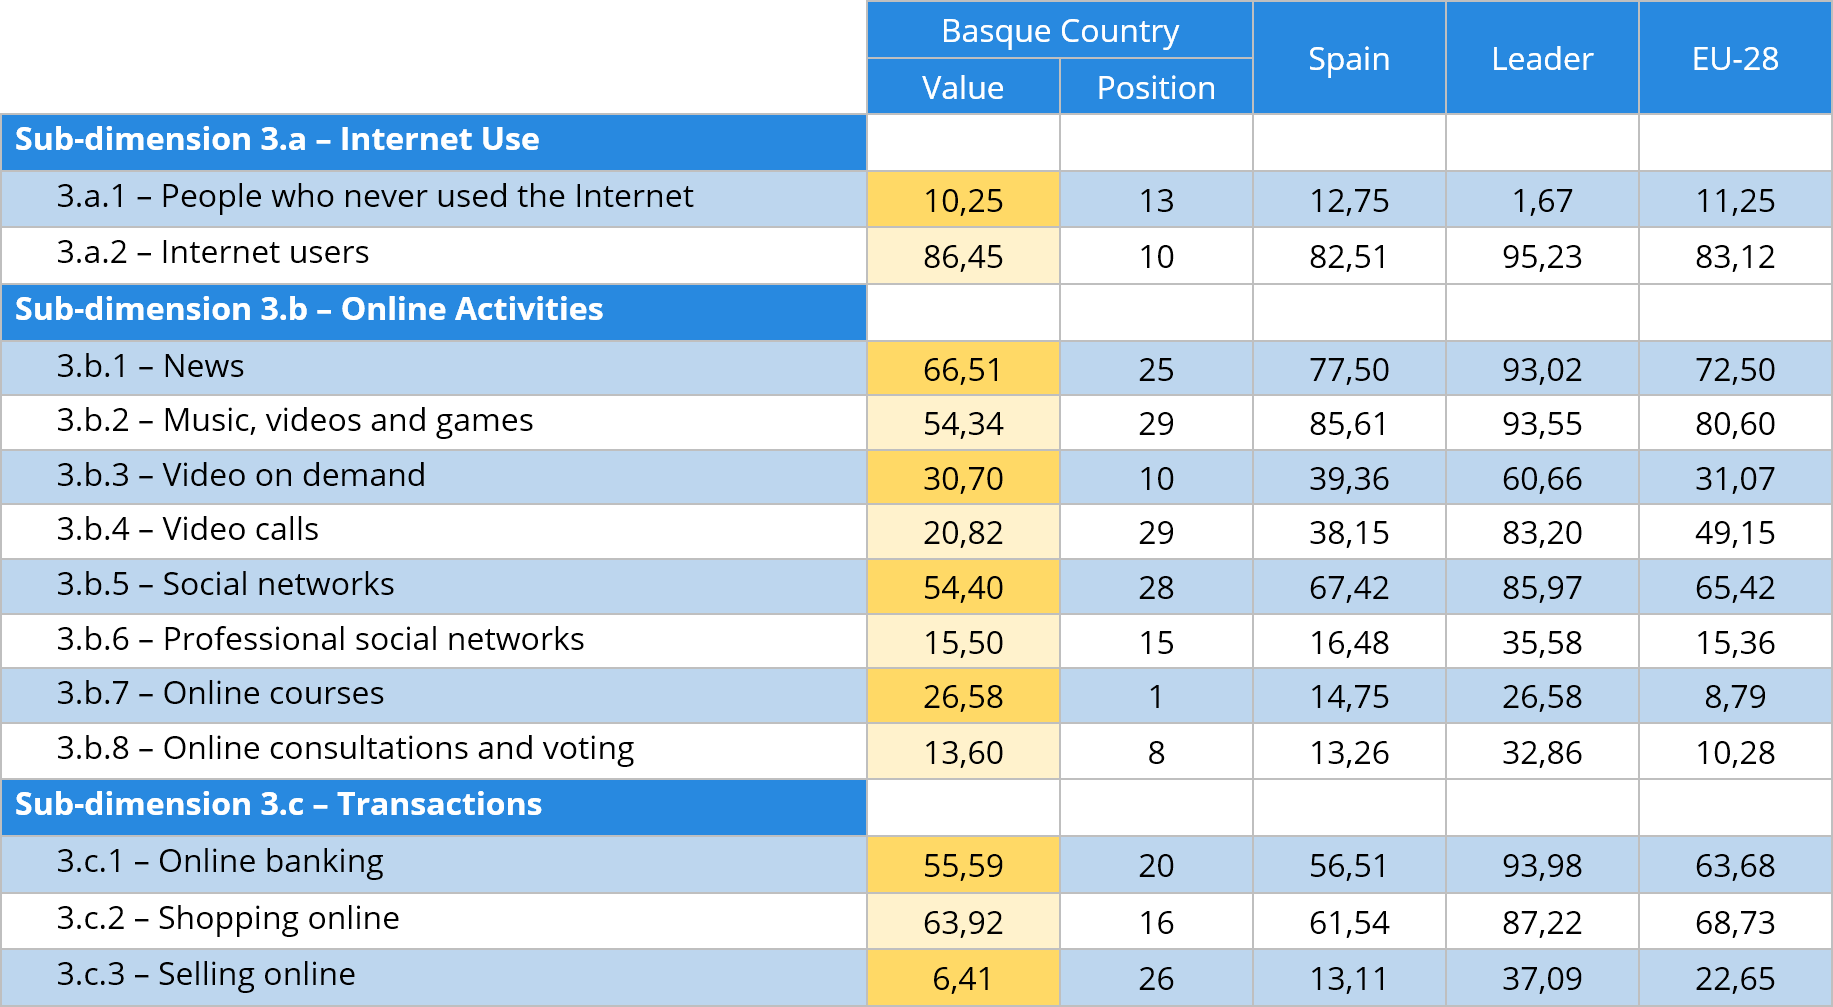
The dimension related to the use of Internet services is the weakest for the Basque Country and this is reflected in most of the indicators that make up the dimension. Of the thirteen indicators, only three have values above the EU-28 average. The online courses indicator stands out, as the Basque Country occupies the first rank and with a wide margin compared to the average. The worst results in terms of positions are in music, videos and games, video calls and social networks.
-
Indicator 3.a.1 is inverse, that is, the lower, the better.