
3. 2017-2018 Evolution of the DESI in the Basque Country
Before comparing the progress between 2017 and 2018, it is essential to point out the change of methodology in the calculation of the DESI indicator for the year 2018. In order to allow comparability between both years, the 2017 indicator must be updated. The incorporation, replacement and updating of the new DESI 2018 indicators, makes it is necessary to recalculate dimensions, sub-dimensions and the DESI 2017 synthetic indicator.
Below is a table comparing the results of the DESI for the years 2017 and 2018, both in terms of scores and position in the ranking.
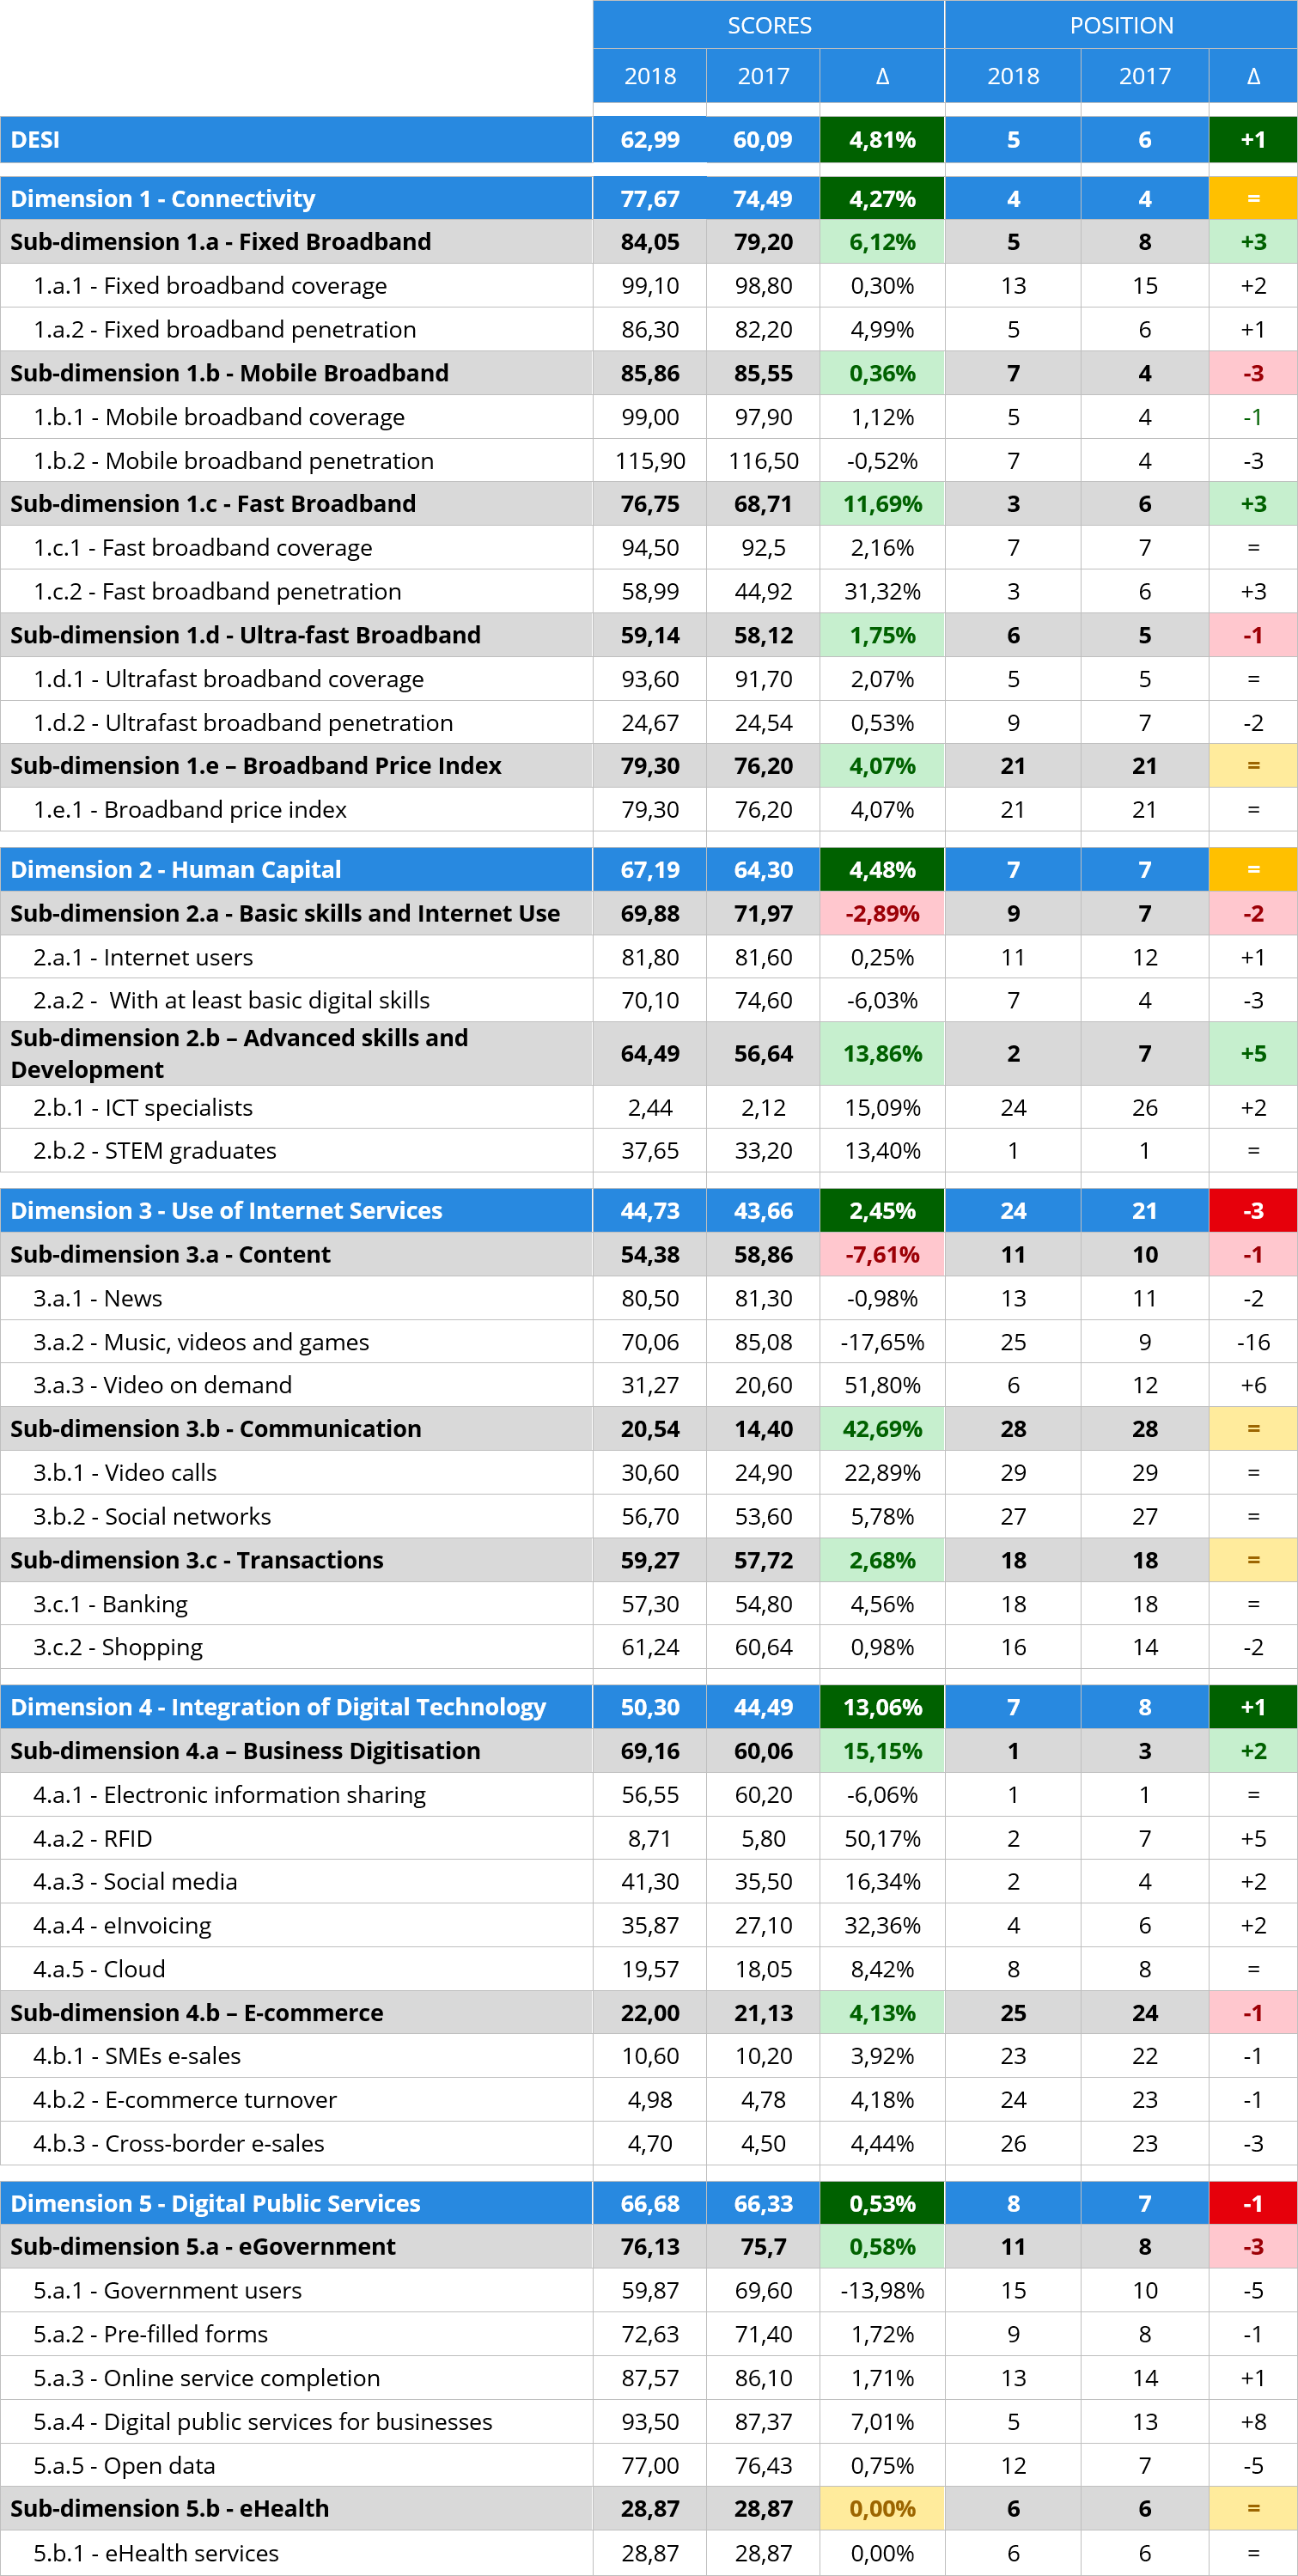
Over the course of the period 2017-2018, the Basque Country's DESI indicator has improved by almost 5 points in comparison with 2017, increasing from 60.09% to 62.99%, and moving up from the sixth to the fifth place. In addition, when examining the difference with the top performing countries, we find convergence with the group of four leading countries insofar as the gap is reduced by 2.26% (decreasing from 14.24% in 2017 to 11.98% in 2018).
In fact, a better performance is observed with respect to the previous year in all dimensions. The most positive evolution has occurred in integration of digital technology in companies, with 13.1%, followed by human capital, connectivity, and use of digital services, which increased by 4.5%, 4.3% and 2.5%, respectively. The use of digital public services has also seen an increase of slightly more than 0.5%.
Nonetheless, it is observed that these improvements have barely enabled the Basque Country to obtain higher scores in relation to the rest of the countries. Consequently, while the relative improvement in both connectivity and human capital enables the Basque Country to maintain its position, a slight improvement in the use of Internet services makes the Basque region move down three places, and the same occurs as the digitisation of public services slows down. Finally, a considerable improvement of 13.1% in integration of digital technology leads the Basque Country to gain a position in the EU.
These data and the comparative analysis of their evolution highlight not only the dynamism of each country in the digitisation of the European economy and society, but also reveal that this is a transforming and an agile process, and that it is essential to continue the already intense efforts.
Regarding ICT specialists, the labour market shows a marked improvement that implies a relative increase compared to the rest of European countries. However, there is a decline in the basic digital skills of citizens.
In the use of Internet-based services, the results show that little progress has been made, due to a similar behaviour in almost all the indicators, except for the consumption of videos on demand. It should be kept in mind that the results in the three sub-dimensions were not favourable in 2017, and hardly any of them have improved.
The digital transformation in companies in terms of adopting technology is advancing at a good pace, with improvements in virtually all indicators, thus allowing already positive positions to advance further in 2018. However, e-commerce still has significant limitations regarding its implementation and effect on business operations.
In the Basque public administration there have been gradual or small improvements in the provision of services, particularly in those aimed at companies. However, despite these developments, there has been a fall in the use of public digital services by citizens.
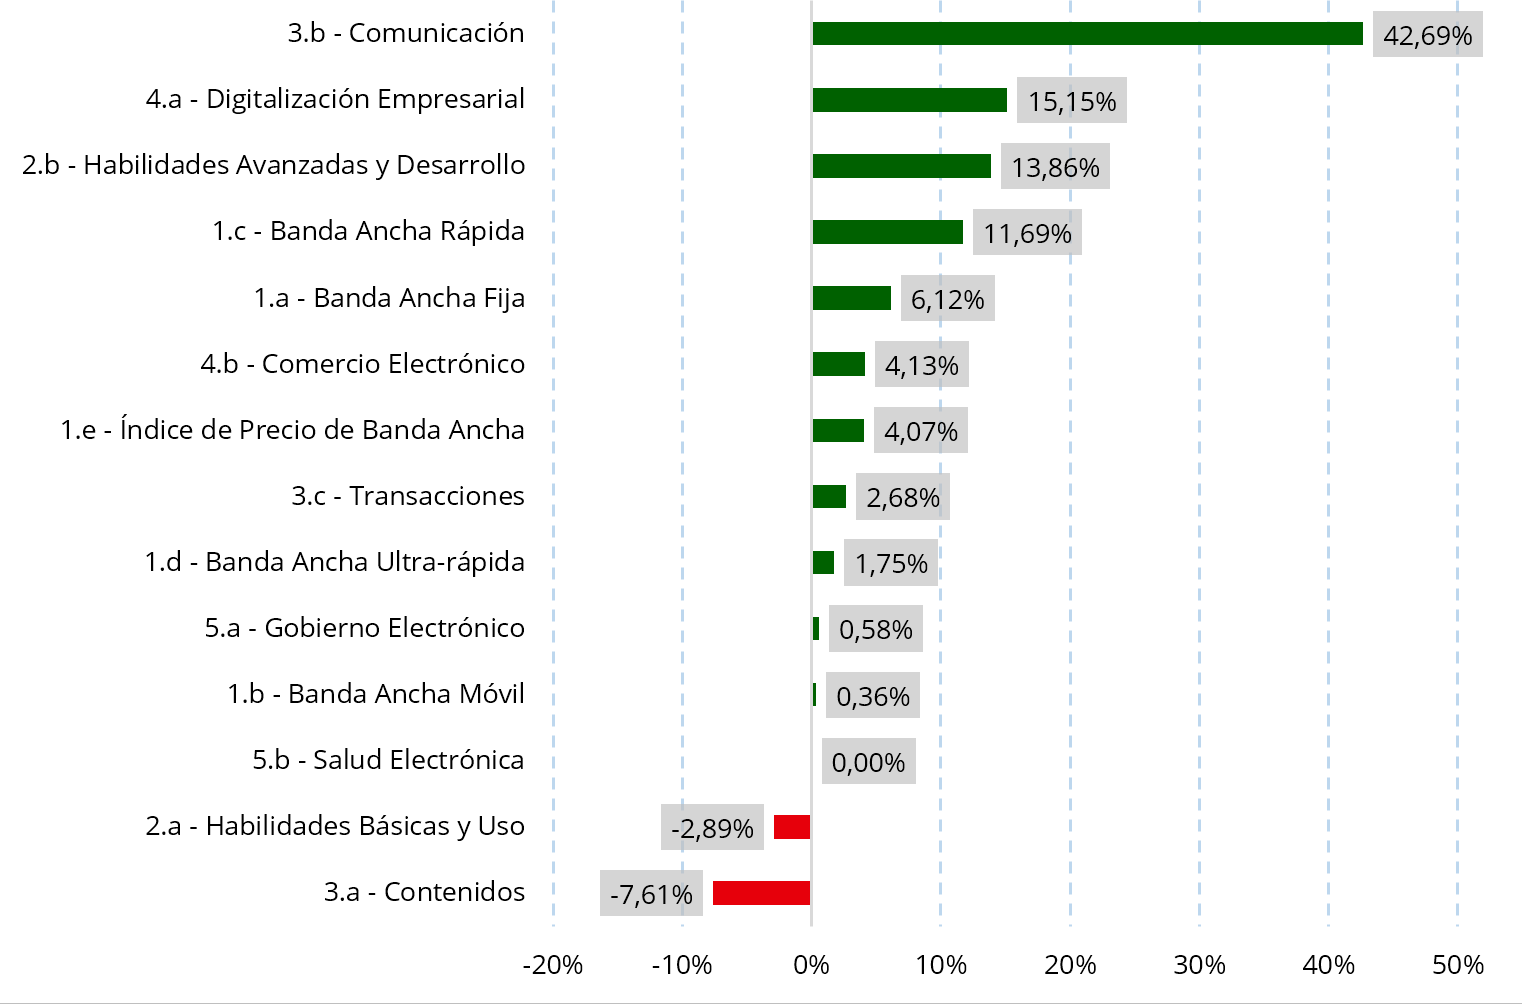
At the level of sub-dimensions, it is in communication that significant progress has been made (42.7%), mainly thanks to the increase in the use of video calls (23%). Other sub-dimensions with fair scores are those of business digitisation, advanced skills and fast broadband, which rose by 15%, 14% and 12%, respectively. The advance in business digitisation is boosted by the improvement in virtually all its indicators, among which radio frequency (RFID) is particularly relevant, increasing by 50%. On the other hand, the outstanding result of the advanced skills sub-dimension contrasts with that of the other sub-dimension related to human capital, basic skills, which falls by 3%.
Of all the 14 sub-dimensions, the Basque Country has obtained higher scores in 11 and yet has only improved its position in 4 of them. Conversely, its position has fallen in 6 sub-dimensions, while in fact the absolute values have worsened in only of 2 of them. What this reveals is that considerable increases are necessary in order to improve relative positions at the sub-dimension level.
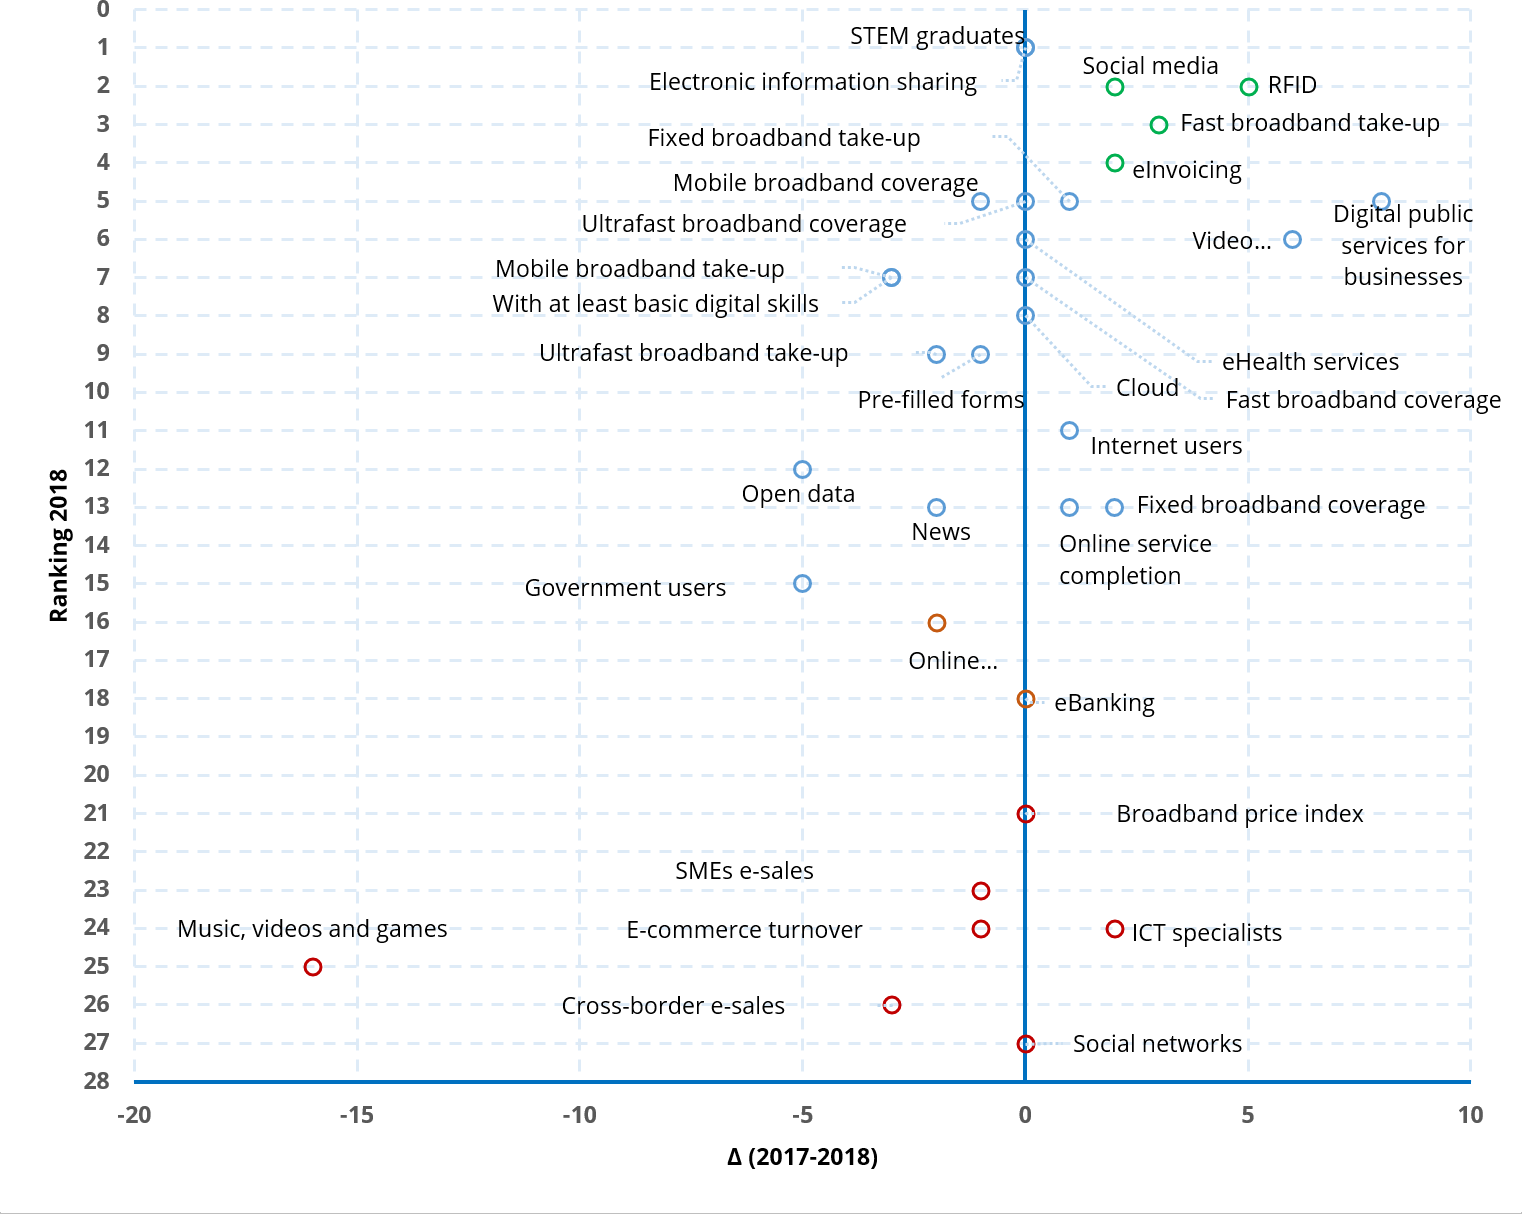
As described for the sub-dimensions, the results of the indicators have a different reading if they are contemplated at the level of absolute values than when their relative positions are examined; 27 of the 34 indicators have obtained better results as compared to 2017, while 6 have slowed down. However, from the point of view of the place occupied by the Basque region, in 10 of them it has progressed and in another 12 it has maintained its position, whereas in 12 it has lost positions.
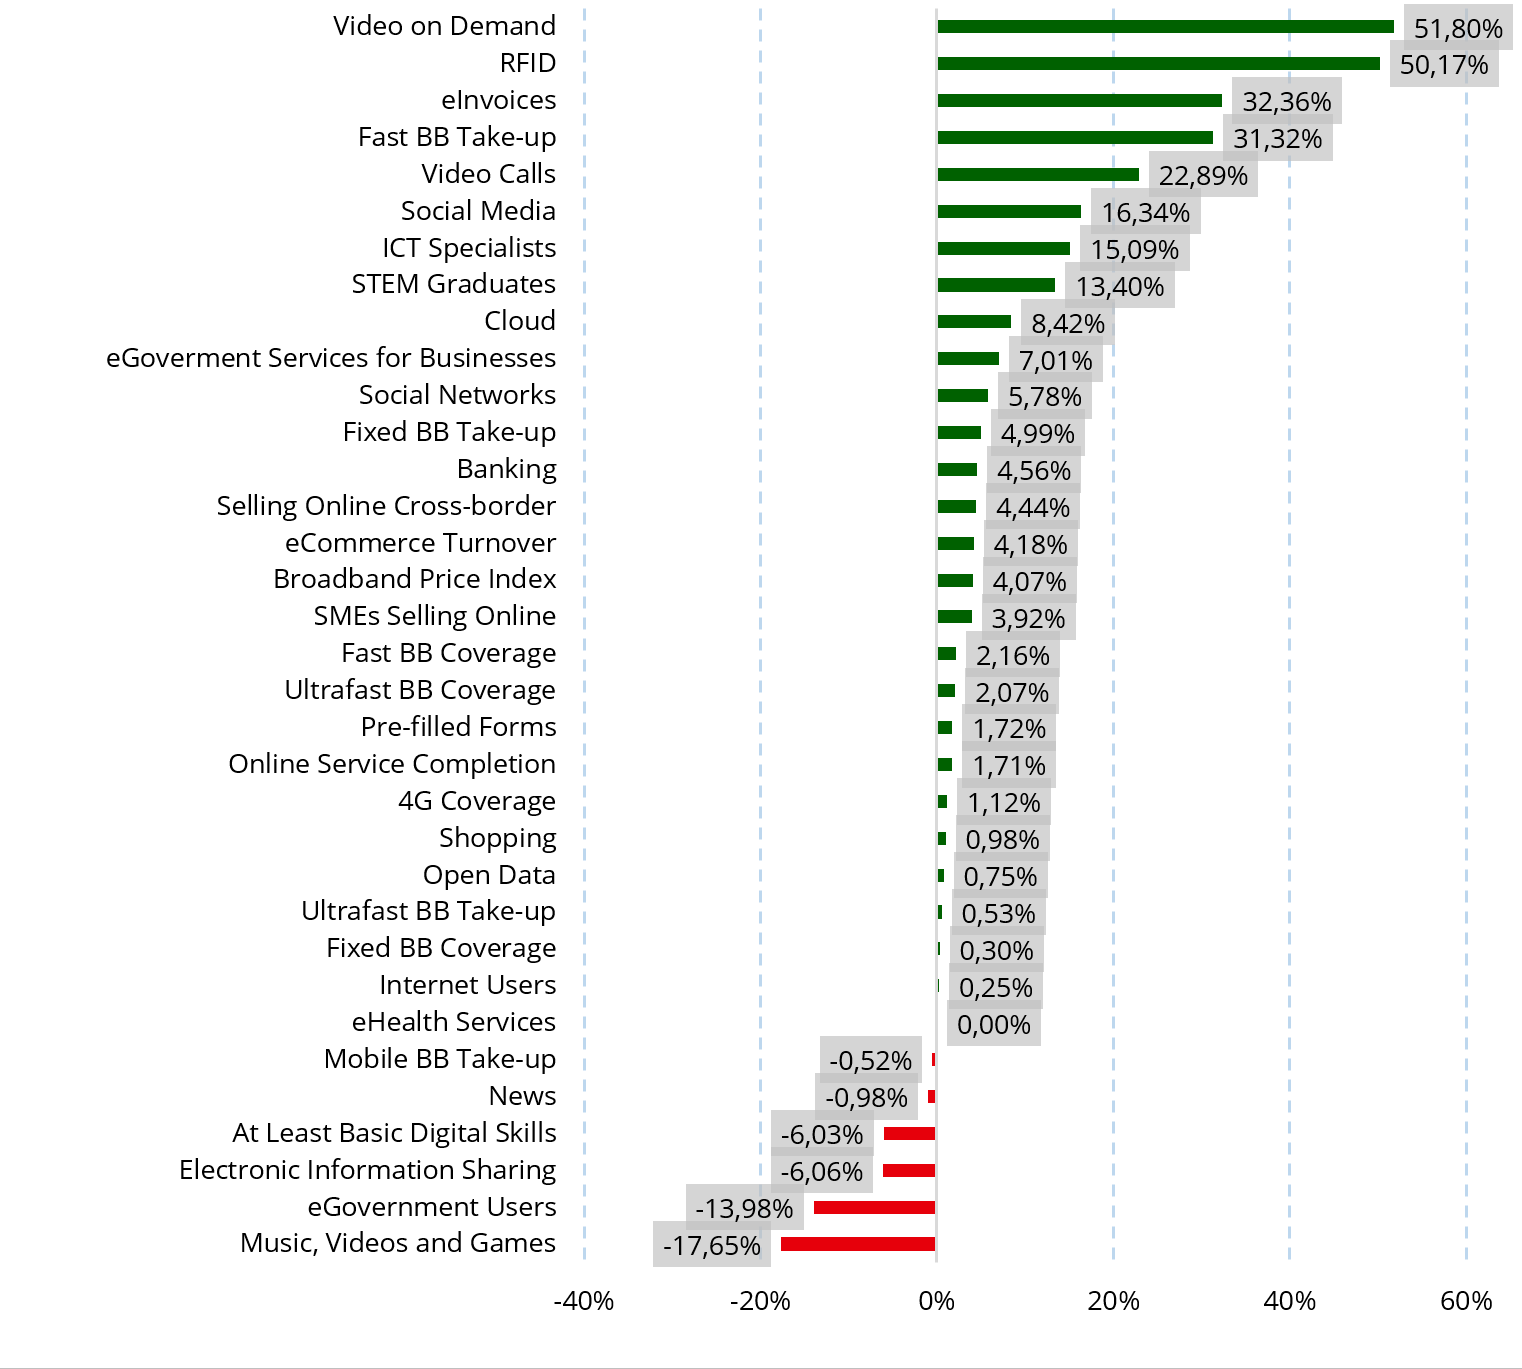
In terms of indicators, as shown in Figure 9, the greatest increments were in video on demand (51.80%), the use of RFID technologies (50.17%) and eInvoicing (32, 3.%) by companies, implementation of fast broadband (31.32%), use of video calls (22.89%) and social media in households (16.34%). ICT specialists in the labour market (15.09%) and STEM graduates (13.40%) also show a positive evolution. On the contrary, the biggest setbacks have occurred in the number of citizens with basic digital skills (-6.03%), electronic information sharing in companies (-6.06%), the share of users of eGovernment digital services (-13.98%) and in downloading music, videos and games (-17.65%).
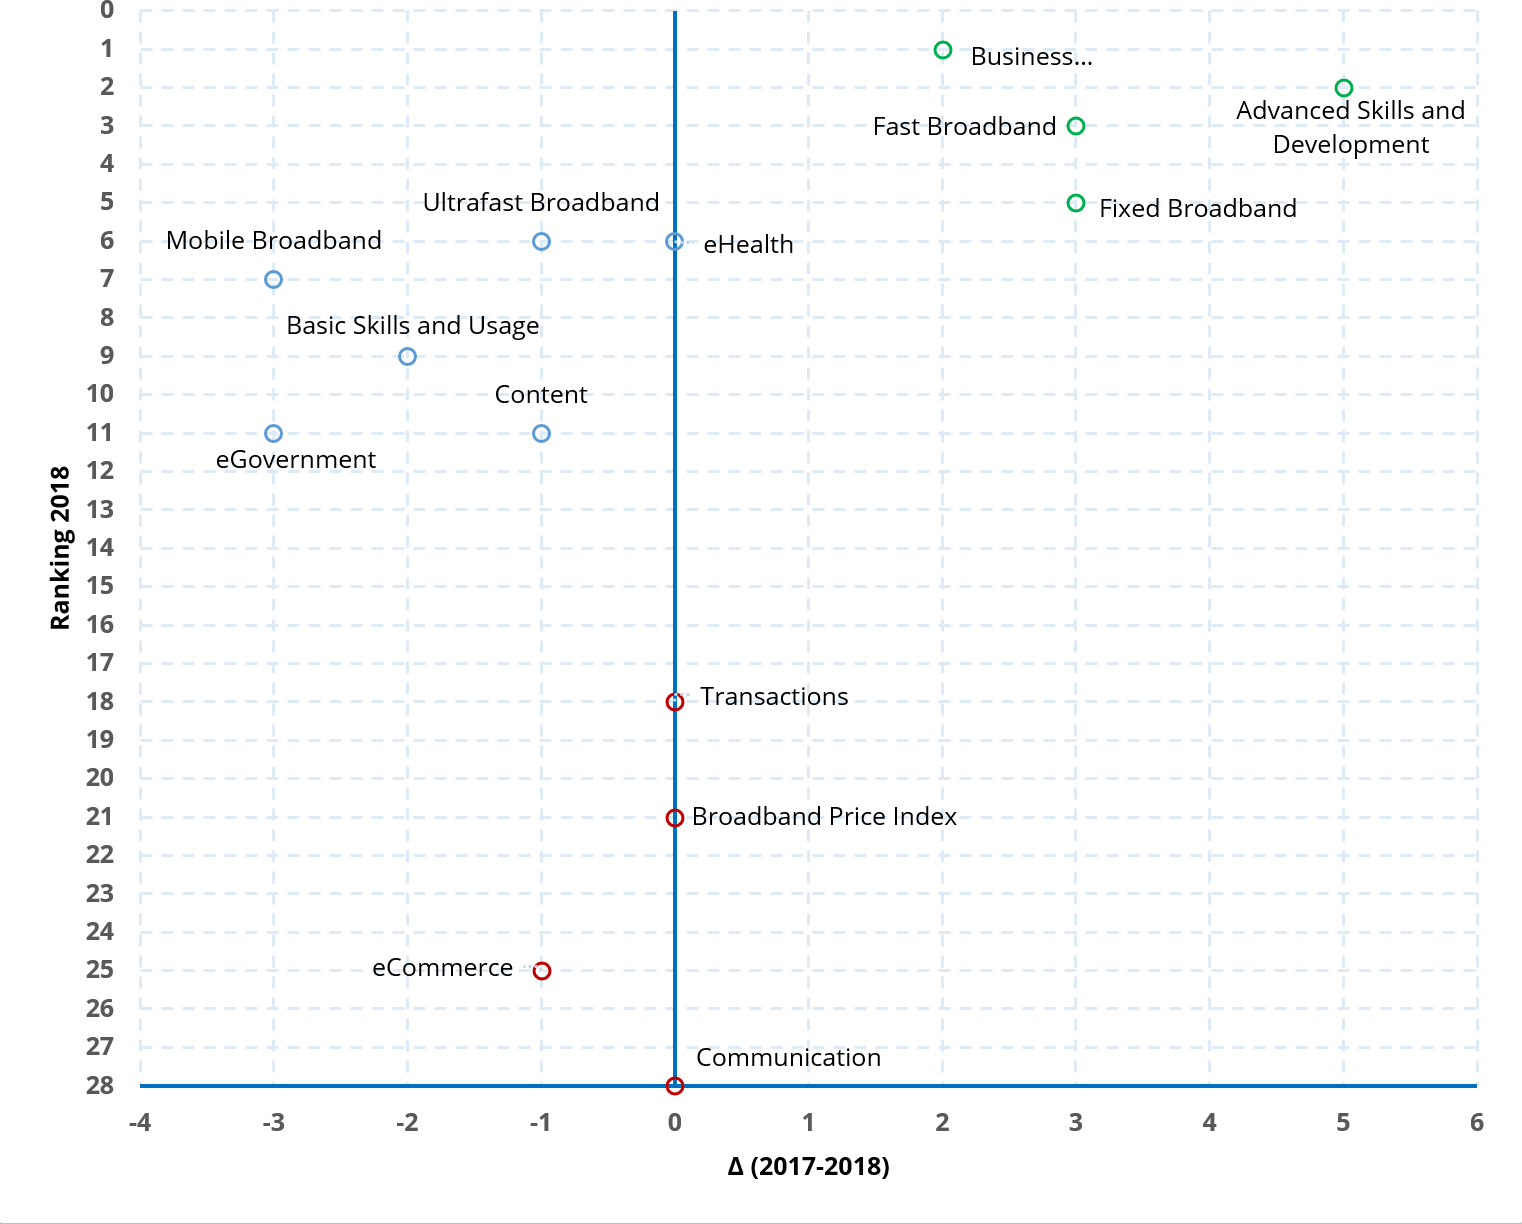
Figure 10 shows a comparative analysis of the positions that each sub-dimension has in 2018 and the progress made since 2017. Three groups of sub-dimensions can be distinguished according to their behaviour. The first includes those which, while maintaining an outstanding position, have experienced relative progress in that position. In this group would be the business digitisation, fast broadband, advanced skills and development, and fixed broadband sub-dimensions and, potentially, the eHealth sub-dimension.
The second group includes the ultrafast broadband, mobile broadband, basic skills and Internet use, the use of digital content and eGovernment sub-dimensions. These sub-dimensions have fallen behind, although in 2018 they continue to be in the upper third of the EU-28 countries.
In a third group there are other sub-dimensions which, lagging behind within in the European framework, have in some cases actually regressed (e-commerce) or remain in the same position (use of economic transactions, the price of access to broadband or the use of digital services for communication).
If we analyse the evolution of the indicators’ rankings, four groups similar in size can be distinguished; the first one brings together the indicators in which the Basque Country reaches an outstanding position and which have maintained or improved their position with respect to 2017. The second group would include those indicators that are in the second highest four, having maintained their position or having experienced slight setbacks. Next to these, there is a third group of indicators beneath the average or with notable setbacks. The fourth group of indicators are those that obtain low scores in 2018. In this group are the indicators with positional setbacks (as is the case of music, videos and games), and maintaining or improving their position in some other case (ICT specialists).
-
Among the indicators that did not exist in 2017, there are two cases in which the data for 2017 could not be obtained. Thus, indicator 5.a.4 has been estimated based on the data for Spain in 2017, and indicator 5.b. 1 has remained the same due to lack of data.
For further information see 5. Methodological Note and 6. Appendix – Indicators and definitions
-
Note about the table: indicator 5.b.1 for 2017, which was not included in the DESI 2017, could not be estimated for that year. Therefore it has been assigned the same value as in 2018.
Indicator 5.a.4, which also did not exist in the DESI 2017 but for which there is data for the other countries, has been estimated based on the data on Spain.
This also happens with the indicator 1.d.2. Indicator 1.d.1 has been obtained directly from the Ministry of Economy and Business, like the rest of coverage indicators.